## Diagram: NVInfo Data Collection
### Overview
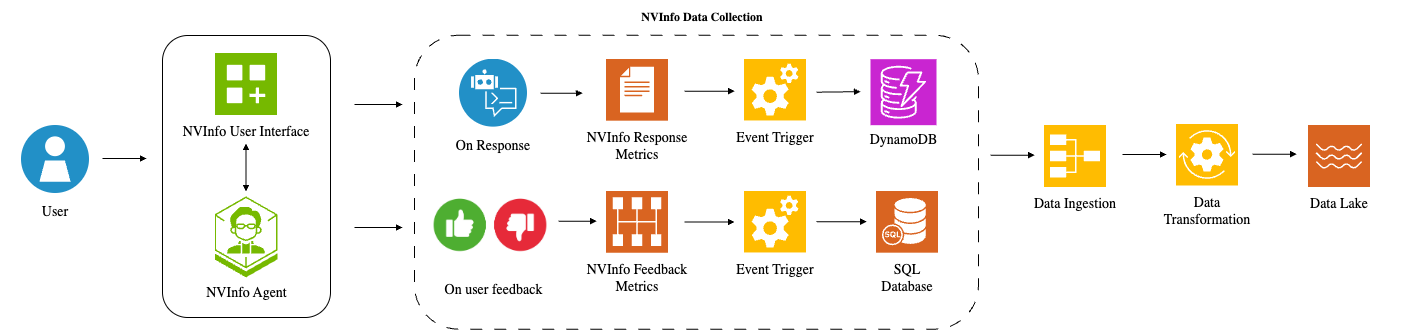
The image is a diagram illustrating the NVInfo data collection process. It shows how user interactions, both through a user interface and direct feedback, are processed and stored in different databases before being ingested, transformed, and finally stored in a data lake.
### Components/Axes
* **Title:** NVInfo Data Collection
* **Left Side:**
* **User:** A blue icon representing a user.
* **NVInfo User Interface:** A green square icon with a grid and a plus sign.
* **NVInfo Agent:** A green hexagon icon with a cartoon of a person wearing glasses.
* **Middle Section (within a dashed rounded rectangle):**
* **On Response:** A blue circle icon with a chat bubble and code snippets.
* **NVInfo Response Metrics:** An orange square icon with lines representing a document.
* **Event Trigger:** A yellow square icon with a gear.
* **DynamoDB:** A purple square icon with stacked cylinders and a lightning bolt.
* **On user feedback:** A green circle icon with a thumbs-up and a red circle icon with a thumbs-down.
* **NVInfo Feedback Metrics:** An orange square icon with a grid pattern.
* **SQL Database:** An orange square icon with stacked cylinders and the letters "SQL".
* **Right Side:**
* **Data Ingestion:** A yellow square icon with three lines converging into a single line.
* **Data Transformation:** A yellow square icon with a gear and arrows rotating around it.
* **Data Lake:** An orange square icon with wavy lines.
* **Arrows:** Arrows indicate the flow of data between components.
### Detailed Analysis
1. **User Interaction:**
* A user interacts with the system through the NVInfo User Interface.
* The user also interacts with the NVInfo Agent.
2. **Data Collection:**
* User interactions trigger "On Response" events, which are then processed into NVInfo Response Metrics.
* User feedback (thumbs up/down) is collected as "On user feedback" and processed into NVInfo Feedback Metrics.
3. **Event Trigger and Storage:**
* Both Response Metrics and Feedback Metrics trigger events.
* Response Metrics are stored in DynamoDB.
* Feedback Metrics are stored in an SQL Database.
4. **Data Processing:**
* Data from DynamoDB and the SQL Database is ingested.
* The ingested data undergoes transformation.
5. **Data Lake:**
* The transformed data is stored in a Data Lake.
### Key Observations
* The diagram illustrates a data pipeline that collects user interactions and feedback, stores them in different databases, and then processes them for storage in a data lake.
* The use of different databases (DynamoDB and SQL Database) suggests that different types of data are being stored and managed.
* The data transformation step is crucial for preparing the data for analysis and use in the data lake.
### Interpretation
The diagram depicts a comprehensive data collection and processing pipeline for NVInfo. It highlights the importance of capturing both direct user input (through the interface and agent) and indirect feedback. The use of separate databases for response metrics and feedback metrics suggests a deliberate strategy for organizing and managing different data types. The final step of storing the transformed data in a data lake indicates a focus on enabling data-driven decision-making and analysis. The diagram suggests a system designed to learn from user interactions and feedback to improve its performance and user experience.