\n
## Diagram: NVInfo Data Collection Flow
### Overview
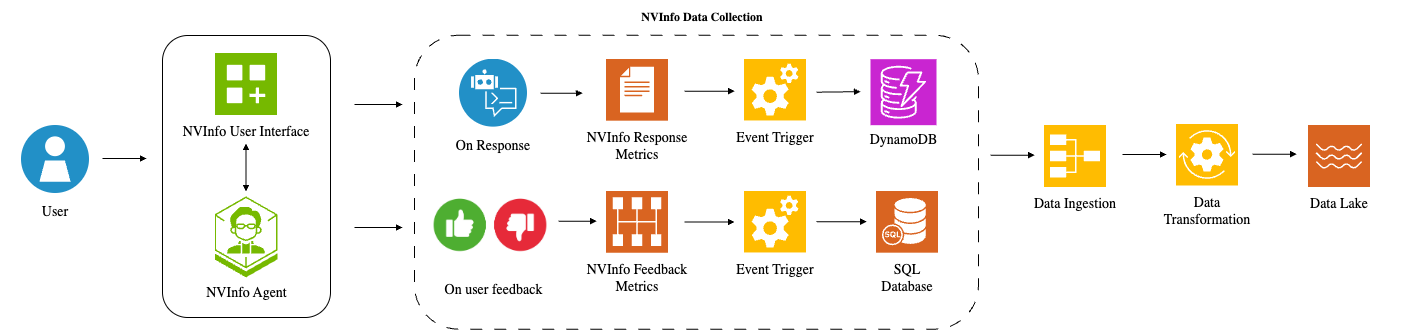
This diagram illustrates the data collection flow for NVInfo, starting from user interaction and culminating in data storage in a Data Lake. The process is split into two main paths: one based on response metrics and another based on user feedback. Both paths involve event triggering, data ingestion, and transformation before reaching the Data Lake.
### Components/Axes
The diagram consists of the following components:
* **User:** Represented by a blue silhouette.
* **NVInfo User Interface:** A blue square with a grid of smaller squares and a plus sign.
* **NVInfo Agent:** A green hexagon with a stylized face.
* **On Response:** A light blue speech bubble with a document icon.
* **NVInfo Response Metrics:** A white rectangle with a document icon.
* **On user feedback:** A red thumbs-up/thumbs-down icon.
* **NVInfo Feedback Metrics:** A red rectangle with a bar graph icon.
* **Event Trigger:** Represented by a yellow gear icon.
* **DynamoDB:** A blue cylinder representing a database.
* **SQL Database:** A green cylinder representing a database.
* **Data Ingestion:** A yellow rectangle.
* **Data Transformation:** A yellow gear icon.
* **Data Lake:** A light blue wavy shape.
* **NVInfo Data Collection:** A dashed grey rectangle encompassing the entire data flow.
Arrows indicate the direction of data flow.
### Detailed Analysis or Content Details
The diagram shows a two-branch data collection process:
**Branch 1: Response Metrics**
1. A User interacts with the NVInfo User Interface.
2. The NVInfo Agent processes the interaction.
3. "On Response" data is generated.
4. "NVInfo Response Metrics" are collected.
5. An "Event Trigger" is activated.
6. Data is stored in DynamoDB.
7. Data is then passed through "Data Ingestion" and "Data Transformation".
8. Finally, data is stored in the "Data Lake".
**Branch 2: User Feedback**
1. A User interacts with the NVInfo User Interface.
2. The NVInfo Agent processes the interaction.
3. "On user feedback" data is generated.
4. "NVInfo Feedback Metrics" are collected.
5. An "Event Trigger" is activated.
6. Data is stored in a SQL Database.
7. Data is then passed through "Data Ingestion" and "Data Transformation".
8. Finally, data is stored in the "Data Lake".
Both branches converge at "Data Ingestion" and proceed through "Data Transformation" to the "Data Lake".
### Key Observations
* The diagram highlights a dual-path data collection strategy, capturing both automated response metrics and explicit user feedback.
* Different database technologies (DynamoDB and SQL Database) are used for storing data from the two branches.
* The "Event Trigger" component appears to be a central element in initiating the data pipeline for both branches.
* The Data Lake serves as the final destination for all collected data.
### Interpretation
The diagram illustrates a robust data collection architecture designed to capture a comprehensive view of NVInfo's performance and user experience. The separation of response metrics and user feedback allows for different types of data to be stored and processed appropriately. DynamoDB, a NoSQL database, is likely used for the high-volume, rapidly changing response metrics, while the SQL Database is used for the more structured user feedback data. The Data Lake provides a centralized repository for all data, enabling further analysis and insights. The use of Event Triggers suggests a real-time or near real-time data processing pipeline. The overall design emphasizes data-driven decision-making and continuous improvement of the NVInfo system. The diagram does not provide any quantitative data, but rather focuses on the flow and components of the data collection process.