## Line Graph: HumanEval Scores vs. Tokens Trained (Billion)
### Overview
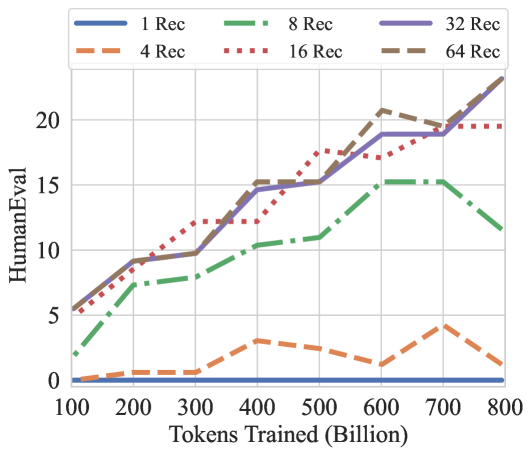
The graph compares HumanEval scores across different "Rec" configurations (1, 4, 8, 16, 32, 64) as a function of tokens trained (in billions). HumanEval scores range from 0 to 20, while tokens trained span 100 to 800 billion. Lines are color-coded and styled uniquely for each Rec value.
### Components/Axes
- **X-axis**: Tokens Trained (Billion) – Logarithmic scale from 100 to 800 billion.
- **Y-axis**: HumanEval – Linear scale from 0 to 20.
- **Legend**: Located in the top-left corner. Entries include:
- **1 Rec**: Blue solid line.
- **4 Rec**: Orange dashed line.
- **8 Rec**: Green dash-dot line.
- **16 Rec**: Red dotted line.
- **32 Rec**: Purple solid line.
- **64 Rec**: Brown dashed line.
### Detailed Analysis
1. **1 Rec (Blue Solid Line)**:
- Starts near 0 at 100B tokens.
- Remains flat throughout, indicating minimal improvement with training.
2. **4 Rec (Orange Dashed Line)**:
- Begins near 0 at 100B tokens.
- Peaks at ~3.5 at ~300B tokens.
- Drops sharply to ~1.5 by 800B tokens.
3. **8 Rec (Green Dash-Dot Line)**:
- Starts at ~2 at 100B tokens.
- Gradually increases to ~10 by 500B tokens.
- Plateaus near 10 for the remainder.
4. **16 Rec (Red Dotted Line)**:
- Starts at ~5 at 100B tokens.
- Rises sharply to ~17 at 500B tokens.
- Plateaus near 17 for the remainder.
5. **32 Rec (Purple Solid Line)**:
- Starts at ~5 at 100B tokens.
- Increases steadily to ~19 at 700B tokens.
- Peaks at ~22 at 800B tokens.
6. **64 Rec (Brown Dashed Line)**:
- Starts at ~5 at 100B tokens.
- Rises sharply to ~20 at 500B tokens.
- Peaks at ~22 at 700B tokens, then slightly declines to ~21 at 800B tokens.
### Key Observations
- Higher Rec values generally correlate with higher HumanEval scores, but performance plateaus or declines after certain token thresholds.
- **64 Rec** achieves the highest peak (~22) but shows a slight decline after 700B tokens.
- **4 Rec** exhibits a pronounced peak (~3.5) followed by a sharp drop, suggesting overfitting or resource limitations.
- **32 Rec** and **64 Rec** lines diverge significantly after 500B tokens, with 64 Rec outperforming 32 Rec.
### Interpretation
The data suggests that increasing Rec values improves HumanEval performance up to a point, after which diminishing returns or overfitting occur. The 64 Rec configuration achieves the highest scores but shows instability at scale, while lower Rec values (e.g., 4 Rec) underperform despite initial gains. This implies a trade-off between model complexity (Rec) and training efficiency, with optimal performance likely requiring careful balancing of Rec and token counts.