## Chart: SmolLM2-1.7B Proportion of Flips vs. Iterations
### Overview
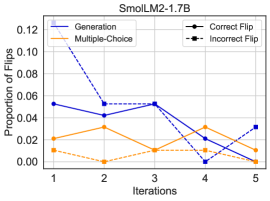
The image is a line chart titled "SmolLM2-1.7B" that displays the proportion of flips across iterations for different categories: Generation, Multiple-Choice, Correct Flip, and Incorrect Flip. The x-axis represents iterations (1 to 5), and the y-axis represents the proportion of flips, ranging from 0.00 to 0.12.
### Components/Axes
* **Title:** SmolLM2-1.7B
* **X-axis:** Iterations (1, 2, 3, 4, 5)
* **Y-axis:** Proportion of Flips (0.00, 0.02, 0.04, 0.06, 0.08, 0.10, 0.12)
* **Legend:** Located at the top-left of the chart.
* Generation (solid dark blue line)
* Multiple-Choice (solid orange line)
* Correct Flip (solid black line with circle markers)
* Incorrect Flip (dashed black line with square markers)
### Detailed Analysis
* **Generation (solid dark blue line):** Starts high, decreases sharply, then remains relatively stable, and finally decreases again.
* Iteration 1: ~0.053
* Iteration 2: ~0.042
* Iteration 3: ~0.053
* Iteration 4: ~0.020
* Iteration 5: ~0.000
* **Multiple-Choice (solid orange line):** Starts relatively low, increases slightly, then decreases, increases again, and finally decreases.
* Iteration 1: ~0.021
* Iteration 2: ~0.031
* Iteration 3: ~0.011
* Iteration 4: ~0.025
* Iteration 5: ~0.000
* **Correct Flip (solid black line with circle markers):** Starts high, decreases sharply, then increases, and finally decreases.
* Iteration 1: ~0.115
* Iteration 2: ~0.052
* Iteration 3: ~0.052
* Iteration 4: ~0.000
* Iteration 5: ~0.000
* **Incorrect Flip (dashed black line with square markers):** Starts low, increases, then decreases, and finally increases.
* Iteration 1: ~0.010
* Iteration 2: ~0.052
* Iteration 3: ~0.010
* Iteration 4: ~0.031
* Iteration 5: ~0.031
### Key Observations
* The "Correct Flip" category starts with the highest proportion of flips but decreases significantly over iterations.
* The "Generation" category also starts relatively high but decreases over iterations.
* The "Multiple-Choice" category remains relatively low throughout the iterations.
* The "Incorrect Flip" category fluctuates but generally remains low.
* All categories converge towards a proportion of flips near 0.00 by the 5th iteration, except for "Incorrect Flip" which ends at ~0.031.
### Interpretation
The chart illustrates how the proportion of flips changes across iterations for different categories in the SmolLM2-1.7B model. The "Correct Flip" category initially has a high proportion of flips, suggesting that the model is making corrections early on. As iterations progress, the proportion of flips decreases for most categories, indicating that the model is converging and becoming more stable. The "Incorrect Flip" category's fluctuations suggest that the model is still making some mistakes, but the overall trend indicates improvement over iterations. The convergence of all categories towards lower proportions of flips suggests that the model is learning and refining its predictions with each iteration.