\n
## Line Chart: SmolLM2-1.7B - Proportion of Flips vs. Iterations
### Overview
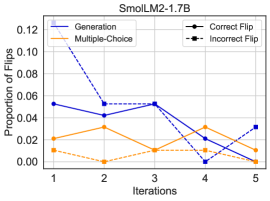
This line chart depicts the proportion of flips across different methods (Generation, Multiple-Choice, Correct Flip, Incorrect Flip) as a function of iteration number, ranging from 1 to 5. The chart appears to be evaluating the performance of a model (SmolLM2-1.7B) over iterative improvements.
### Components/Axes
* **Title:** SmolLM2-1.7B
* **X-axis:** Iterations (labeled 1, 2, 3, 4, 5)
* **Y-axis:** Proportion of Flips (labeled, scale from 0.00 to 0.12, increments of 0.02)
* **Legend:**
* Generation (Blue solid line)
* Multiple-Choice (Orange solid line)
* Correct Flip (Black solid line with circle markers)
* Incorrect Flip (Gray dashed line with square markers)
### Detailed Analysis
The chart displays four distinct lines representing the proportion of flips for each method across the five iterations.
* **Generation (Blue):** This line starts at approximately 0.055 at iteration 1, sharply increases to a peak of approximately 0.105 at iteration 2, then declines steadily to approximately 0.03 at iteration 5.
* **Multiple-Choice (Orange):** This line begins at approximately 0.02 at iteration 1, increases to approximately 0.035 at iteration 2, then fluctuates around 0.02-0.03, ending at approximately 0.025 at iteration 5.
* **Correct Flip (Black):** This line starts at approximately 0.05 at iteration 1, decreases to approximately 0.04 at iteration 2, increases to approximately 0.055 at iteration 3, then declines to approximately 0.03 at iteration 5.
* **Incorrect Flip (Gray):** This line begins at approximately 0.05 at iteration 1, increases to approximately 0.055 at iteration 3, then declines to approximately 0.01 at iteration 5.
Here's a table summarizing the approximate values:
| Iteration | Generation | Multiple-Choice | Correct Flip | Incorrect Flip |
|---|---|---|---|---|
| 1 | 0.055 | 0.02 | 0.05 | 0.05 |
| 2 | 0.105 | 0.035 | 0.04 | 0.055 |
| 3 | 0.08 | 0.03 | 0.055 | 0.055 |
| 4 | 0.04 | 0.03 | 0.02 | 0.02 |
| 5 | 0.03 | 0.025 | 0.03 | 0.01 |
### Key Observations
* The "Generation" method exhibits the most significant fluctuation, with a large increase in flips at iteration 2 followed by a consistent decline.
* "Multiple-Choice" remains relatively stable throughout the iterations, with a slight increase initially.
* "Incorrect Flip" shows a decreasing trend, indicating a reduction in incorrect flips as iterations progress.
* "Correct Flip" fluctuates, but generally decreases over the iterations.
### Interpretation
The data suggests that the "Generation" method initially experiences a period of instability or exploration (iteration 2), leading to a higher proportion of flips, before converging towards a more stable state. The "Multiple-Choice" method demonstrates a more consistent performance, indicating a potentially more robust approach. The decreasing trend in "Incorrect Flip" suggests that the model is learning to avoid incorrect responses over time. The fluctuations in "Correct Flip" could be due to the inherent variability in the task or the model's learning process.
The chart provides insights into the iterative improvement of the SmolLM2-1.7B model, highlighting the strengths and weaknesses of different methods in terms of flip proportion. The "Generation" method, while initially volatile, shows potential for improvement, while the "Multiple-Choice" method offers a more stable baseline. The overall trend of decreasing "Incorrect Flip" indicates that the model is learning and refining its responses with each iteration.