## Line Chart: SmolLM2-1.7B - Proportion of Flips Over Iterations
### Overview
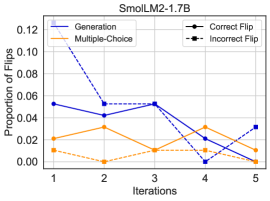
This is a line chart titled "SmolLM2-1.7B" that plots the "Proportion of Flips" against "Iterations" for four distinct data series. The chart tracks the performance or behavior of a model (likely a language model) across five sequential iterations, measuring different types of "flips" or changes.
### Components/Axes
* **Chart Title:** "SmolLM2-1.7B" (Top Center)
* **X-Axis:** Labeled "Iterations". It has discrete, evenly spaced markers for values 1, 2, 3, 4, and 5.
* **Y-Axis:** Labeled "Proportion of Flips". The scale is linear, ranging from 0.00 to 0.12, with major tick marks at intervals of 0.02 (0.00, 0.02, 0.04, 0.06, 0.08, 0.10, 0.12).
* **Legend:** Positioned in the top-right corner of the plot area. It defines four series:
1. **Generation:** Solid blue line.
2. **Multiple-Choice:** Solid orange line.
3. **Correct Flip:** Dashed blue line with circular markers.
4. **Incorrect Flip:** Dashed orange line with circular markers.
### Detailed Analysis
**Data Series Trends & Approximate Values:**
1. **Correct Flip (Dashed Blue Line):**
* **Trend:** Shows a steep, overall downward trend. It starts as the highest value and ends near zero.
* **Data Points:**
* Iteration 1: ~0.12 (Highest point on the entire chart)
* Iteration 2: ~0.05
* Iteration 3: ~0.05 (Plateau from Iteration 2)
* Iteration 4: ~0.00
* Iteration 5: ~0.00
2. **Generation (Solid Blue Line):**
* **Trend:** Fluctuates with a notable dip at Iteration 4.
* **Data Points:**
* Iteration 1: ~0.05
* Iteration 2: ~0.045
* Iteration 3: ~0.05
* Iteration 4: ~0.00 (Sharp drop, matches the Incorrect Flip value)
* Iteration 5: ~0.035
3. **Multiple-Choice (Solid Orange Line):**
* **Trend:** Rises to a peak at Iteration 2, then gradually declines.
* **Data Points:**
* Iteration 1: ~0.02
* Iteration 2: ~0.04 (Peak for this series)
* Iteration 3: ~0.015
* Iteration 4: ~0.035
* Iteration 5: ~0.00
4. **Incorrect Flip (Dashed Orange Line):**
* **Trend:** Remains consistently low, near the baseline, with minor fluctuations.
* **Data Points:**
* Iteration 1: ~0.02
* Iteration 2: ~0.00
* Iteration 3: ~0.01
* Iteration 4: ~0.00
* Iteration 5: ~0.005
### Key Observations
* **Dominant Initial Value:** The "Correct Flip" proportion is overwhelmingly high at the first iteration (0.12), more than double any other series at that point.
* **Convergence at Iteration 4:** At Iteration 4, three of the four series ("Generation", "Correct Flip", "Incorrect Flip") converge at or very near 0.00. This is a significant anomaly or event point in the sequence.
* **Inverse Relationship (Early Iterations):** Between Iterations 1 and 2, as the "Correct Flip" proportion drops sharply (0.12 to 0.05), the "Multiple-Choice" proportion rises (0.02 to 0.04).
* **Final State (Iteration 5):** By the final iteration, only the "Generation" series shows a non-trivial proportion (~0.035). All other series are at or below ~0.005.
### Interpretation
The chart likely visualizes the internal dynamics of the SmolLM2-1.7B model during a multi-step process (e.g., iterative refinement, training, or evaluation). The "Proportion of Flips" could refer to changes in model outputs, predictions, or internal states.
* **What the data suggests:** The process begins with a high rate of "Correct Flips," which rapidly diminishes, suggesting the model quickly stabilizes or converges on correct answers. The "Generation" metric, which may represent novel or sampled outputs, shows more volatility, with a near-total collapse at Iteration 4 before a partial recovery. The consistently low "Incorrect Flip" rate is a positive indicator, suggesting the model rarely makes erroneous changes.
* **How elements relate:** The inverse movement between "Correct Flip" and "Multiple-Choice" in early iterations could indicate a trade-off or transition in the model's strategy—perhaps shifting from correcting itself to exploring multiple-choice options. The universal low point at Iteration 4 is critical; it may represent a reset, a point of maximum stability, or a specific intervention in the process.
* **Notable anomalies:** The sharp, synchronized drop to near-zero for three metrics at Iteration 4 is the most striking feature. This is not a gradual trend but a discrete event. The subsequent partial recovery of only the "Generation" metric suggests that whatever caused the Iteration 4 event primarily suppressed non-generative behaviors.
**Language Note:** All text in the image is in English.