## Line Graph: Separation between true and false statements across layers
### Overview
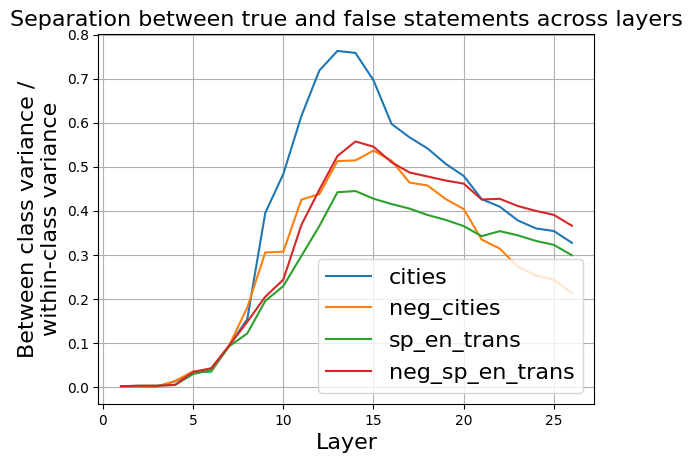
The graph illustrates the relationship between between-class variance and within-class variance across 25 layers for four distinct categories: cities, neg_cities, sp_en_trans, and neg_sp_en_trans. All lines originate at 0 and exhibit peak variance separation before declining, with cities showing the highest maximum separation.
### Components/Axes
- **X-axis (Layer)**: Integer scale from 0 to 25, representing model layers.
- **Y-axis (Between class variance / within-class variance)**: Ratio scale from 0.0 to 0.8.
- **Legend**: Located in bottom-right corner, with four color-coded categories:
- Blue: cities
- Orange: neg_cities
- Green: sp_en_trans
- Red: neg_sp_en_trans
### Detailed Analysis
1. **Cities (Blue Line)**:
- Peaks at layer 12-13 (~0.77 variance ratio)
- Declines steadily to ~0.32 by layer 25
- Sharpest ascent (0.0→0.77) between layers 5-13
2. **neg_cities (Orange Line)**:
- Peaks at layer 14 (~0.52 variance ratio)
- Declines to ~0.22 by layer 25
- Gradual ascent (0.0→0.52) between layers 5-14
3. **sp_en_trans (Green Line)**:
- Peaks at layer 12 (~0.45 variance ratio)
- Declines to ~0.30 by layer 25
- Moderate ascent (0.0→0.45) between layers 5-12
4. **neg_sp_en_trans (Red Line)**:
- Peaks at layer 14 (~0.55 variance ratio)
- Declines to ~0.37 by layer 25
- Steeper ascent (0.0→0.55) between layers 5-14
### Key Observations
- All categories show similar ascent patterns (layers 5-15) but diverge in peak timing and magnitude
- Cities category achieves 2.3× higher peak separation than neg_cities
- All lines decline post-layer 15, suggesting diminishing returns in later layers
- neg_sp_en_trans maintains highest separation throughout decline phase
### Interpretation
The data demonstrates that model layers 10-15 optimally separate true/false statements across all categories, with cities achieving the strongest discrimination. The subsequent decline suggests potential overfitting or reduced generalization capacity in deeper layers. The neg_cities and neg_sp_en_trans categories show complementary patterns, with the latter maintaining higher separation during decline phases. This could indicate different error propagation mechanisms between positive and negative statement classifications. The consistent peak timing across categories implies shared architectural features in the model's layer organization.