## Line Charts: Model Performance on Math Problems
### Overview
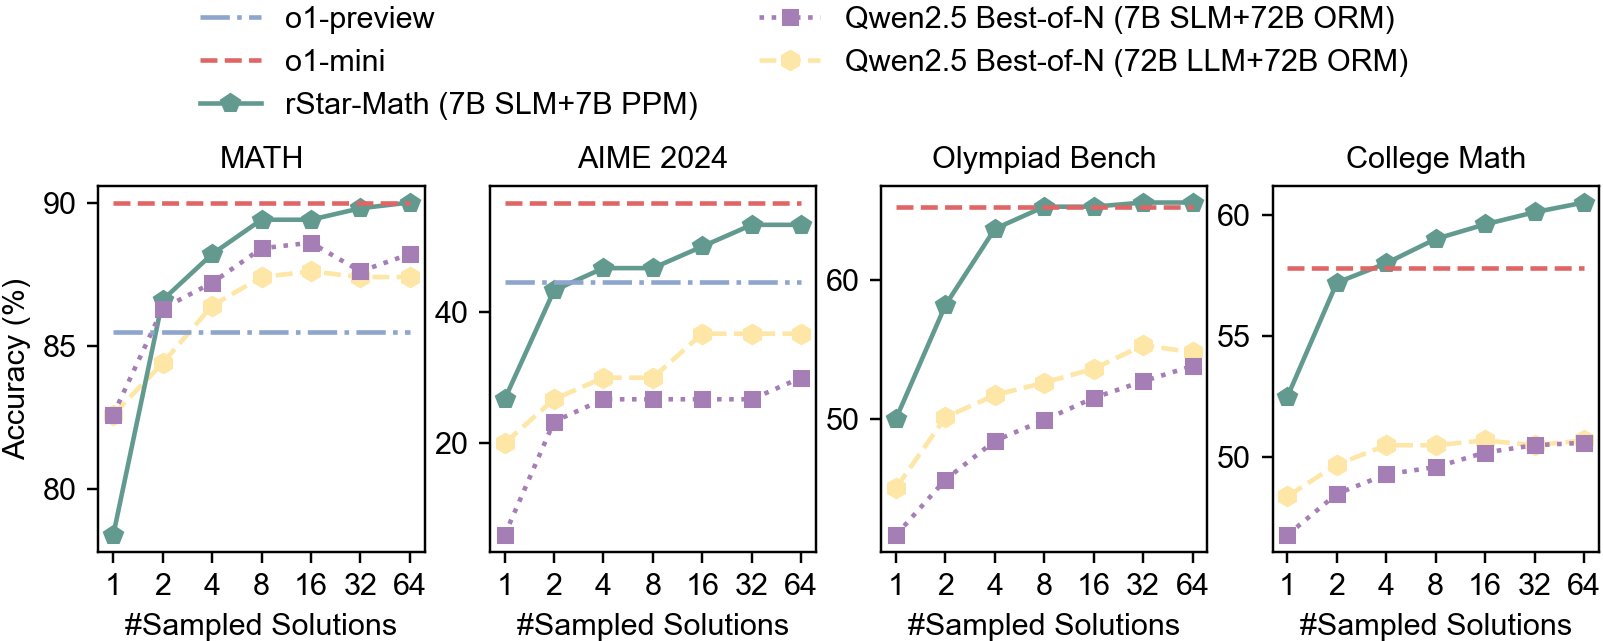
The image contains four line charts comparing the performance of different language models on various math problem sets. The charts display accuracy (%) as a function of the number of sampled solutions. The models compared are "o1-preview", "o1-mini", "rStar-Math (7B SLM+7B PPM)", "Qwen2.5 Best-of-N (7B SLM+72B ORM)", and "Qwen2.5 Best-of-N (72B LLM+72B ORM)". The problem sets are "MATH", "AIME 2024", "Olympiad Bench", and "College Math".
### Components/Axes
* **X-axis (Horizontal):** "#Sampled Solutions" with values 1, 2, 4, 8, 16, 32, 64.
* **Y-axis (Vertical):** "Accuracy (%)" with values ranging from 80 to 90 for the MATH chart, 20 to 40 for the AIME 2024 chart, 50 to 60 for the Olympiad Bench chart, and 50 to 60 for the College Math chart.
* **Legends (Top):**
* `o1-preview`: Light Blue, dashed-dotted line.
* `o1-mini`: Red, dashed line.
* `rStar-Math (7B SLM+7B PPM)`: Green, solid line with pentagon markers.
* `Qwen2.5 Best-of-N (7B SLM+72B ORM)`: Purple, dotted line with square markers.
* `Qwen2.5 Best-of-N (72B LLM+72B ORM)`: Yellow, dashed line with hexagon markers.
* **Chart Titles (Top):** MATH, AIME 2024, Olympiad Bench, College Math.
### Detailed Analysis
**1. MATH Chart:**
* `o1-preview` (Light Blue, dashed-dotted line): Constant accuracy at approximately 86%.
* `o1-mini` (Red, dashed line): Constant accuracy at approximately 90%.
* `rStar-Math (7B SLM+7B PPM)` (Green, solid line with pentagon markers): Starts at approximately 78% accuracy with 1 sampled solution, increases sharply to approximately 87% at 2 sampled solutions, then gradually increases to approximately 90% at 64 sampled solutions.
* `Qwen2.5 Best-of-N (7B SLM+72B ORM)` (Purple, dotted line with square markers): Starts at approximately 82% accuracy with 1 sampled solution, increases to approximately 87% at 8 sampled solutions, and then plateaus.
* `Qwen2.5 Best-of-N (72B LLM+72B ORM)` (Yellow, dashed line with hexagon markers): Starts at approximately 84% accuracy with 1 sampled solution, increases to approximately 87% at 8 sampled solutions, and then plateaus.
**2. AIME 2024 Chart:**
* `o1-preview` (Light Blue, dashed-dotted line): Constant accuracy at approximately 42%.
* `o1-mini` (Red, dashed line): Constant accuracy at approximately 45%.
* `rStar-Math (7B SLM+7B PPM)` (Green, solid line with pentagon markers): Starts at approximately 25% accuracy with 1 sampled solution, increases to approximately 45% at 8 sampled solutions, and then plateaus.
* `Qwen2.5 Best-of-N (7B SLM+72B ORM)` (Purple, dotted line with square markers): Starts at approximately 5% accuracy with 1 sampled solution, increases to approximately 25% at 64 sampled solutions.
* `Qwen2.5 Best-of-N (72B LLM+72B ORM)` (Yellow, dashed line with hexagon markers): Starts at approximately 20% accuracy with 1 sampled solution, increases to approximately 38% at 64 sampled solutions.
**3. Olympiad Bench Chart:**
* `o1-preview` (Light Blue, dashed-dotted line): Constant accuracy at approximately 42%.
* `o1-mini` (Red, dashed line): Constant accuracy at approximately 62%.
* `rStar-Math (7B SLM+7B PPM)` (Green, solid line with pentagon markers): Starts at approximately 50% accuracy with 1 sampled solution, increases to approximately 62% at 8 sampled solutions, and then plateaus.
* `Qwen2.5 Best-of-N (7B SLM+72B ORM)` (Purple, dotted line with square markers): Starts at approximately 48% accuracy with 1 sampled solution, increases to approximately 53% at 64 sampled solutions.
* `Qwen2.5 Best-of-N (72B LLM+72B ORM)` (Yellow, dashed line with hexagon markers): Starts at approximately 50% accuracy with 1 sampled solution, increases to approximately 55% at 64 sampled solutions.
**4. College Math Chart:**
* `o1-preview` (Light Blue, dashed-dotted line): Constant accuracy at approximately 42%.
* `o1-mini` (Red, dashed line): Constant accuracy at approximately 58%.
* `rStar-Math (7B SLM+7B PPM)` (Green, solid line with pentagon markers): Starts at approximately 52% accuracy with 1 sampled solution, increases to approximately 62% at 64 sampled solutions.
* `Qwen2.5 Best-of-N (7B SLM+72B ORM)` (Purple, dotted line with square markers): Starts at approximately 47% accuracy with 1 sampled solution, increases to approximately 51% at 64 sampled solutions.
* `Qwen2.5 Best-of-N (72B LLM+72B ORM)` (Yellow, dashed line with hexagon markers): Starts at approximately 48% accuracy with 1 sampled solution, increases to approximately 52% at 64 sampled solutions.
### Key Observations
* `o1-mini` consistently achieves the highest accuracy among all models on the MATH and Olympiad Bench datasets.
* `rStar-Math` shows a significant improvement in accuracy as the number of sampled solutions increases, particularly in the AIME 2024 dataset.
* `o1-preview` shows a constant accuracy across all numbers of sampled solutions.
* The performance of `Qwen2.5 Best-of-N` models is generally lower than `rStar-Math` and `o1-mini` across all datasets.
### Interpretation
The charts illustrate the performance of different language models on various math problem sets, highlighting the impact of the number of sampled solutions on accuracy. The `o1-mini` model appears to be the most effective on the MATH and Olympiad Bench datasets, while `rStar-Math` demonstrates a notable improvement with increased sampling, especially on the AIME 2024 dataset. The consistent performance of `o1-preview` suggests a stable but potentially less adaptable model. The `Qwen2.5 Best-of-N` models show lower overall accuracy compared to the other models, indicating potential areas for improvement in their architecture or training. The data suggests that increasing the number of sampled solutions can significantly enhance the performance of certain models, particularly `rStar-Math`, while others, like `o1-preview`, may benefit more from architectural or training enhancements.