\n
## Chart: Model Performance on Math Benchmarks vs. Sampled Solutions
### Overview
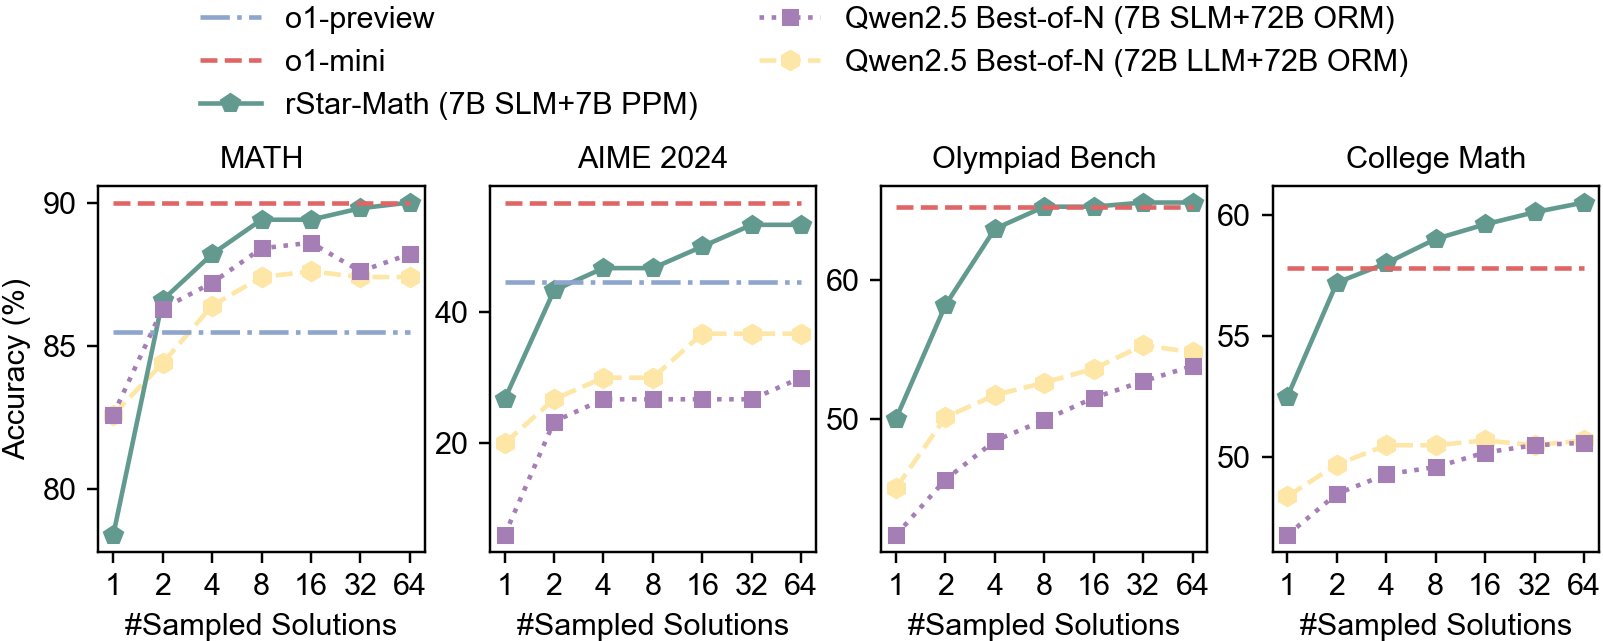
The image presents a comparative analysis of four language models – o1-preview, o1-mini, rStar-Math, and Qwen2.5 (with two variants: Best-of-N and LLM+ORM) – across four distinct math benchmarks: MATH, AIME 2024, Olympiad Bench, and College Math. The performance metric is accuracy (in percentage), plotted against the number of sampled solutions. Each benchmark is represented by a separate subplot.
### Components/Axes
* **X-axis (all subplots):** "#Sampled Solutions" with markers at 1, 2, 4, 8, 16, 32, and 64.
* **Y-axis (all subplots):** "Accuracy (%)" ranging from approximately 20% to 90%, with increments of 10%.
* **Legend (top-right):**
* `o1-preview` (light blue, solid line)
* `o1-mini` (red, dashed line)
* `rStar-Math` (green, solid line with triangle markers)
* `Qwen2.5 Best-of-N (7B SLM+72B ORM)` (purple, dotted line)
* `Qwen2.5 Best-of-N (72B LLM+72B ORM)` (orange, dotted line with circle markers)
* **Subplot Titles (top-center of each subplot):**
* MATH
* AIME 2024
* Olympiad Bench
* College Math
### Detailed Analysis or Content Details
**MATH Subplot:**
* `rStar-Math`: Starts at approximately 82% accuracy at 1 sampled solution, rises sharply to around 92% at 8 sampled solutions, and plateaus around 92-93% for the remaining sampled solutions.
* `o1-preview`: Starts at approximately 80% accuracy at 1 sampled solution, increases steadily to around 88% at 64 sampled solutions.
* `o1-mini`: Starts at approximately 78% accuracy at 1 sampled solution, increases to around 85% at 64 sampled solutions.
* `Qwen2.5 Best-of-N (7B SLM+72B ORM)`: Starts at approximately 75% accuracy at 1 sampled solution, increases to around 82% at 64 sampled solutions.
* `Qwen2.5 Best-of-N (72B LLM+72B ORM)`: Remains relatively flat around 80-82% accuracy across all sampled solutions.
**AIME 2024 Subplot:**
* `rStar-Math`: Shows a steep increase from approximately 20% at 1 sampled solution to around 45% at 32 sampled solutions, then plateaus around 45-47%.
* `o1-preview`: Increases steadily from approximately 20% at 1 sampled solution to around 35% at 64 sampled solutions.
* `o1-mini`: Starts at approximately 15% accuracy at 1 sampled solution, increases to around 25% at 64 sampled solutions.
* `Qwen2.5 Best-of-N (7B SLM+72B ORM)`: Increases from approximately 15% at 1 sampled solution to around 28% at 64 sampled solutions.
* `Qwen2.5 Best-of-N (72B LLM+72B ORM)`: Starts at approximately 18% accuracy at 1 sampled solution, increases to around 30% at 64 sampled solutions.
**Olympiad Bench Subplot:**
* `rStar-Math`: Increases rapidly from approximately 45% at 1 sampled solution to around 68% at 32 sampled solutions, then plateaus around 68-70%.
* `o1-preview`: Increases steadily from approximately 45% at 1 sampled solution to around 58% at 64 sampled solutions.
* `o1-mini`: Starts at approximately 40% accuracy at 1 sampled solution, increases to around 50% at 64 sampled solutions.
* `Qwen2.5 Best-of-N (7B SLM+72B ORM)`: Increases from approximately 40% at 1 sampled solution to around 52% at 64 sampled solutions.
* `Qwen2.5 Best-of-N (72B LLM+72B ORM)`: Remains relatively flat around 50-52% accuracy across all sampled solutions.
**College Math Subplot:**
* `rStar-Math`: Increases from approximately 52% at 1 sampled solution to around 65% at 64 sampled solutions.
* `o1-preview`: Increases steadily from approximately 52% at 1 sampled solution to around 62% at 64 sampled solutions.
* `o1-mini`: Starts at approximately 50% accuracy at 1 sampled solution, increases to around 58% at 64 sampled solutions.
* `Qwen2.5 Best-of-N (7B SLM+72B ORM)`: Increases from approximately 50% at 1 sampled solution to around 56% at 64 sampled solutions.
* `Qwen2.5 Best-of-N (72B LLM+72B ORM)`: Remains relatively flat around 50-52% accuracy across all sampled solutions.
### Key Observations
* `rStar-Math` consistently outperforms other models on all benchmarks, especially at higher numbers of sampled solutions.
* The performance of `Qwen2.5 Best-of-N (72B LLM+72B ORM)` plateaus quickly and does not improve significantly with more sampled solutions.
* `o1-preview` generally outperforms `o1-mini` across all benchmarks.
* The AIME 2024 benchmark shows the lowest overall accuracy scores compared to the other benchmarks.
### Interpretation
The data suggests that increasing the number of sampled solutions generally improves the accuracy of the language models, but the rate of improvement diminishes as the number of samples increases. `rStar-Math` demonstrates a superior ability to leverage sampled solutions for improved performance, particularly on the more challenging benchmarks like MATH and Olympiad Bench. The plateauing performance of `Qwen2.5 Best-of-N (72B LLM+72B ORM)` indicates a potential limitation in its architecture or training data, preventing it from effectively utilizing additional sampled solutions. The lower accuracy scores on the AIME 2024 benchmark suggest that this benchmark presents a unique challenge for these models, potentially requiring different strategies or training data. The consistent performance differences between the models highlight the importance of model architecture and training methodology in achieving high accuracy on math benchmarks.