## Multi-Panel Line Chart: Model Accuracy vs. Number of Sampled Solutions
### Overview
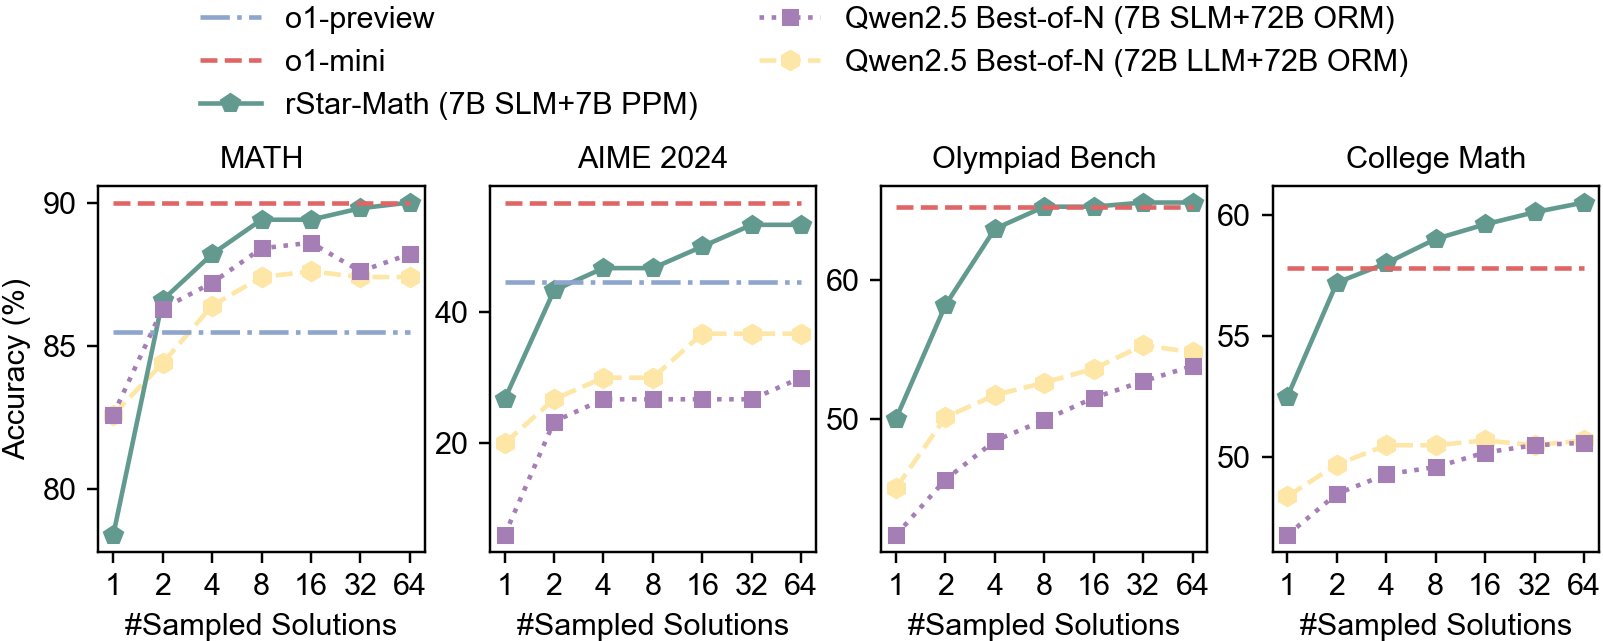
The image contains four line charts (panels) comparing the accuracy (in percentage) of five models across varying numbers of sampled solutions (x - axis: 1, 2, 4, 8, 16, 32, 64, logarithmic base - 2 scale). The panels are labeled “MATH”, “AIME 2024”, “Olympiad Bench”, and “College Math”. The y - axis for each panel represents “Accuracy (%)” with different ranges per panel.
### Components/Axes
- **X - axis (all panels)**: “#Sampled Solutions” with values 1, 2, 4, 8, 16, 32, 64 (logarithmic, base - 2 scale).
- **Y - axis (per panel)**:
- MATH: 78–90%
- AIME 2024: 20–45%
- Olympiad Bench: 45–65%
- College Math: 45–60%
- **Legend (top of image)**:
- o1 - preview: Blue dashed line (flat across sampled solutions).
- o1 - mini: Red dashed line (flat across sampled solutions).
- rStar - Math (7B SLM + 7B PPM): Teal solid line with circular markers (increasing trend).
- Qwen2.5 Best - of - N (7B SLM + 72B ORM): Purple dotted line with square markers (increasing trend).
- Qwen2.5 Best - of - N (72B LLM + 72B ORM): Yellow dotted line with circular markers (increasing trend).
### Detailed Analysis (Per Panel)
#### 1. MATH Panel
- **o1 - preview (blue dashed)**: Flat at ~85% accuracy (no change with sampled solutions).
- **o1 - mini (red dashed)**: Flat at ~90% accuracy (no change with sampled solutions).
- **rStar - Math (teal)**: Starts at ~78% (x = 1), rises to ~90% (x = 64). Trend: Strongly increasing with sampled solutions.
- **Qwen2.5 (7B SLM + 72B ORM, purple squares)**: Starts at ~82% (x = 1), rises to ~88% (x = 64). Trend: Increasing.
- **Qwen2.5 (72B LLM + 72B ORM, yellow circles)**: Starts at ~83% (x = 1), rises to ~87% (x = 64). Trend: Increasing.
#### 2. AIME 2024 Panel
- **o1 - preview (blue dashed)**: Flat at ~45% accuracy (no change with sampled solutions).
- **o1 - mini (red dashed)**: Flat at ~45% accuracy (no change with sampled solutions).
- **rStar - Math (teal)**: Starts at ~25% (x = 1), rises to ~45% (x = 64). Trend: Increasing.
- **Qwen2.5 (7B SLM + 72B ORM, purple squares)**: Starts at ~15% (x = 1), rises to ~30% (x = 64). Trend: Increasing.
- **Qwen2.5 (72B LLM + 72B ORM, yellow circles)**: Starts at ~20% (x = 1), rises to ~35% (x = 64). Trend: Increasing.
#### 3. Olympiad Bench Panel
- **o1 - preview (blue dashed)**: Flat at ~65% accuracy (no change with sampled solutions).
- **o1 - mini (red dashed)**: Flat at ~65% accuracy (no change with sampled solutions).
- **rStar - Math (teal)**: Starts at ~50% (x = 1), rises to ~65% (x = 64). Trend: Increasing.
- **Qwen2.5 (7B SLM + 72B ORM, purple squares)**: Starts at ~45% (x = 1), rises to ~55% (x = 64). Trend: Increasing.
- **Qwen2.5 (72B LLM + 72B ORM, yellow circles)**: Starts at ~48% (x = 1), rises to ~58% (x = 64). Trend: Increasing.
#### 4. College Math Panel
- **o1 - preview (blue dashed)**: Flat at ~58% accuracy (no change with sampled solutions).
- **o1 - mini (red dashed)**: Flat at ~58% accuracy (no change with sampled solutions).
- **rStar - Math (teal)**: Starts at ~52% (x = 1), rises to ~60% (x = 64). Trend: Increasing.
- **Qwen2.5 (7B SLM + 72B ORM, purple squares)**: Starts at ~45% (x = 1), rises to ~50% (x = 64). Trend: Increasing.
- **Qwen2.5 (72B LLM + 72B ORM, yellow circles)**: Starts at ~47% (x = 1), rises to ~52% (x = 64). Trend: Increasing.
### Key Observations
- **Flat Trends (o1 - preview, o1 - mini)**: These models show no accuracy improvement with more sampled solutions (flat lines), indicating their performance is independent of the number of solutions sampled.
- **Increasing Trends (rStar - Math, Qwen2.5 variants)**: All three models with “Best - of - N” or “rStar - Math” show accuracy increasing with more sampled solutions, meaning sampling more solutions improves their performance.
- **Model Comparison**:
- In MATH, o1 - mini (red) outperforms o1 - preview (blue) and Qwen2.5 variants, while rStar - Math approaches o1 - mini’s accuracy at high sampled solutions.
- In AIME 2024, Olympiad Bench, and College Math, o1 - preview and o1 - mini (both ~45%, ~65%, ~58% respectively) outperform Qwen2.5 variants, with rStar - Math approaching their accuracy at x = 64.
### Interpretation
The data implies that o1 - preview and o1 - mini have stable accuracy regardless of the number of sampled solutions, suggesting their performance is robust or not dependent on sampling more solutions. In contrast, rStar - Math and Qwen2.5 Best - of - N models benefit from more sampled solutions, with accuracy increasing as the number of solutions sampled grows. This could mean these models rely on sampling multiple solutions to find the best one (e.g., via a “best - of - N” strategy), while o1 - preview and o1 - mini might have a more deterministic or single - solution approach. The consistent outperformance of o1 - preview and o1 - mini across most panels (except MATH, where rStar - Math catches up) suggests they are more effective for these math - related tasks, especially when sampling solutions is not a factor. The increasing trend for rStar - Math and Qwen2.5 variants highlights the value of sampling more solutions for these models, potentially due to their reliance on generating multiple candidates and selecting the best one.