## Line Graphs: Model Performance Across Benchmarks
### Overview
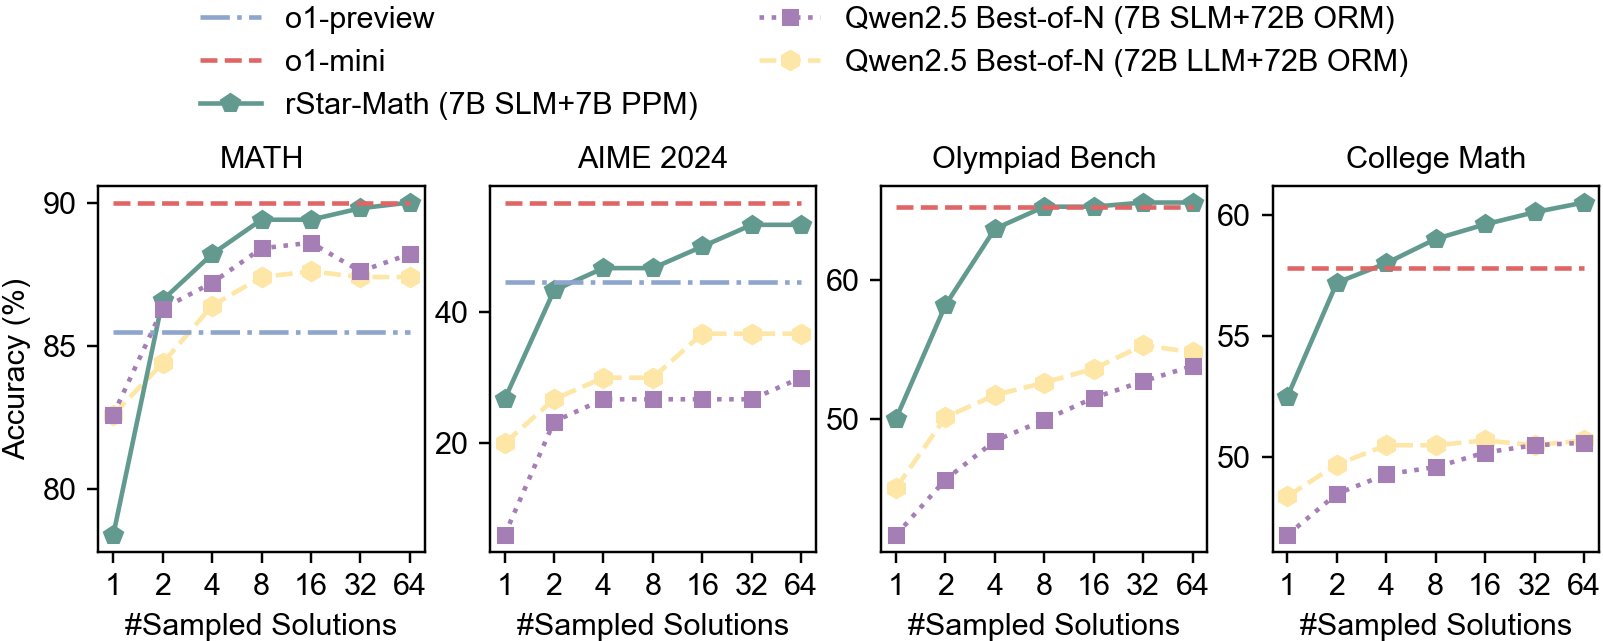
The image contains four line graphs comparing the accuracy of different AI models across four benchmarks: MATH, AIME 2024, Olympiad Bench, and College Math. Each graph plots accuracy (%) against the number of sampled solutions (1, 2, 4, 8, 16, 32, 64). Models include o1-preview, o1-mini, rStar-Math, and two variants of Gwen2.5 Best-of-N.
### Components/Axes
- **X-axis**: "#Sampled Solutions" (logarithmic scale: 1, 2, 4, 8, 16, 32, 64).
- **Y-axis**: "Accuracy (%)" (ranging from ~75% to 90% in MATH, ~20% to 90% in AIME 2024, ~50% to 60% in Olympiad Bench, and ~50% to 60% in College Math).
- **Legends**: Located in the top-left corner of each graph, with distinct line styles and colors:
- **o1-preview**: Blue dashed line.
- **o1-mini**: Red dashed line.
- **rStar-Math (7B SLM+7B PPM)**: Green solid line.
- **Gwen2.5 Best-of-N (7B SLM+72B ORM)**: Purple dotted line.
- **Gwen2.5 Best-of-N (72B LLM+72B ORM)**: Yellow dotted line.
### Detailed Analysis
#### MATH
- **rStar-Math**: Starts at ~75% accuracy with 1 sample, rising sharply to ~90% by 64 samples.
- **o1-mini**: Flat at ~90% accuracy across all sample counts.
- **o1-preview**: Begins at ~85%, plateaus near 85% after 8 samples.
- **Gwen2.5 Models**: Both variants start below 85%, with the 72B LLM+ORM variant reaching ~88% at 64 samples.
#### AIME 2024
- **rStar-Math**: Starts at ~20%, rising to ~85% by 64 samples.
- **o1-mini**: Flat at ~40% accuracy.
- **o1-preview**: Flat at ~40% accuracy.
- **Gwen2.5 Models**: Both variants plateau near ~30% accuracy.
#### Olympiad Bench
- **rStar-Math**: Starts at ~50%, rising to ~60% by 64 samples.
- **o1-mini**: Flat at ~60% accuracy.
- **o1-preview**: Starts at ~50%, plateaus near 55%.
- **Gwen2.5 Models**: Both variants reach ~55% accuracy at 64 samples.
#### College Math
- **rStar-Math**: Starts at ~50%, rising to ~60% by 64 samples.
- **o1-mini**: Flat at ~55% accuracy.
- **o1-preview**: Starts at ~50%, plateaus near 55%.
- **Gwen2.5 Models**: Both variants reach ~55% accuracy at 64 samples.
### Key Observations
1. **rStar-Math** consistently improves with more samples across all benchmarks, outperforming other models in MATH and AIME 2024.
2. **o1-mini** maintains flat performance, suggesting limited sensitivity to sampling.
3. **Gwen2.5 Models** underperform compared to rStar-Math and o1-mini, with the 72B LLM+ORM variant slightly outperforming the 7B SLM+ORM variant.
4. **o1-preview** shows minimal improvement, indicating potential inefficiencies in scaling.
### Interpretation
The data suggests that **rStar-Math** is the most effective model for these benchmarks, particularly in MATH and AIME 2024, where it achieves near-human-level accuracy with sufficient sampling. The **o1-mini** model’s flat performance implies it may be optimized for specific tasks or constrained by architectural limitations. The **Gwen2.5 Models**’ lower accuracy could reflect suboptimal configurations (e.g., smaller parameter sizes) or training data gaps. The **o1-preview**’s stagnant performance raises questions about its scalability or training methodology. Overall, the results highlight the importance of model architecture and sampling efficiency in achieving high accuracy.