## Bar Chart: Model Performance Comparison
### Overview
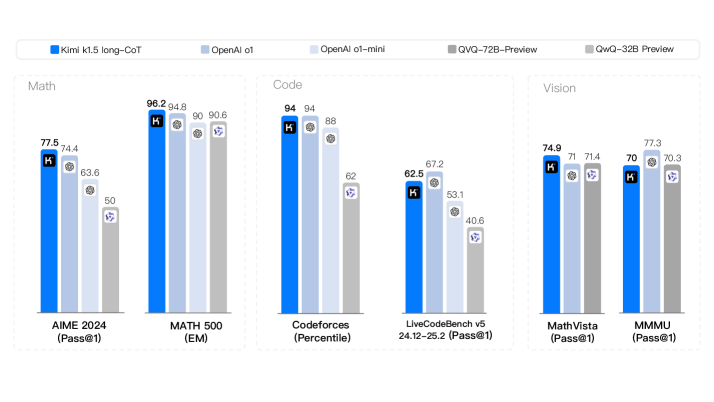
The image is a bar chart comparing the performance of five different language models (Kimi k1.5 long-CoT, OpenAI o1, OpenAI o1-mini, QVQ-72B-Preview, and QwQ-32B Preview) across three categories: Math, Code, and Vision. The chart displays the performance of each model on specific tasks within each category, with performance measured as a percentage.
### Components/Axes
* **Title:** Model Performance Comparison (inferred)
* **X-axis:** Represents different tasks within each category (Math, Code, Vision).
* **Math:** AIME 2024 (Pass@1), MATH 500 (EM)
* **Code:** Codeforces (Percentile), LiveCodeBench v5 24.12-25.2 (Pass@1)
* **Vision:** MathVista (Pass@1), MMMU (Pass@1)
* **Y-axis:** Represents performance as a percentage (implied, but not explicitly labeled). The values range from approximately 40 to 97.
* **Legend:** Located at the top of the chart.
* Blue: Kimi k1.5 long-CoT
* Light Blue: OpenAI o1
* Gray: OpenAI o1-mini
* Light Gray: QVQ-72B-Preview
* Lighter Gray: QwQ-32B Preview
### Detailed Analysis
#### Math Category
* **AIME 2024 (Pass@1):**
* Kimi k1.5 long-CoT (Blue): 77.5
* OpenAI o1 (Light Blue): 74.4
* OpenAI o1-mini (Gray): 63.6
* QVQ-72B-Preview (Light Gray): 50
* QwQ-32B Preview (Lighter Gray): Not present
* **MATH 500 (EM):**
* Kimi k1.5 long-CoT (Blue): 96.2
* OpenAI o1 (Light Blue): 94.8
* OpenAI o1-mini (Gray): 90
* QVQ-72B-Preview (Light Gray): 90.6
* QwQ-32B Preview (Lighter Gray): Not present
#### Code Category
* **Codeforces (Percentile):**
* Kimi k1.5 long-CoT (Blue): 94
* OpenAI o1 (Light Blue): 94
* OpenAI o1-mini (Gray): 88
* QVQ-72B-Preview (Light Gray): 62
* QwQ-32B Preview (Lighter Gray): Not present
* **LiveCodeBench v5 24.12-25.2 (Pass@1):**
* Kimi k1.5 long-CoT (Blue): 62.5
* OpenAI o1 (Light Blue): 67.2
* OpenAI o1-mini (Gray): 53.1
* QVQ-72B-Preview (Light Gray): 40.6
* QwQ-32B Preview (Lighter Gray): Not present
#### Vision Category
* **MathVista (Pass@1):**
* Kimi k1.5 long-CoT (Blue): 74.9
* OpenAI o1 (Light Blue): 71
* OpenAI o1-mini (Gray): 71.4
* QVQ-72B-Preview (Light Gray): Not present
* QwQ-32B Preview (Lighter Gray): Not present
* **MMMU (Pass@1):**
* Kimi k1.5 long-CoT (Blue): 70
* OpenAI o1 (Light Blue): 77.3
* OpenAI o1-mini (Gray): 70.3
* QVQ-72B-Preview (Light Gray): Not present
* QwQ-32B Preview (Lighter Gray): Not present
### Key Observations
* Kimi k1.5 long-CoT (Blue) generally performs well across all tasks, often achieving the highest or near-highest scores.
* OpenAI o1 (Light Blue) consistently performs competitively, often close to Kimi k1.5 long-CoT.
* OpenAI o1-mini (Gray) generally scores lower than Kimi k1.5 long-CoT and OpenAI o1.
* QVQ-72B-Preview (Light Gray) tends to have the lowest scores among the models tested.
* QwQ-32B Preview (Lighter Gray) is only present in the Math category.
* The performance varies significantly across different tasks within each category, indicating that the models have different strengths and weaknesses.
### Interpretation
The bar chart provides a comparative analysis of the performance of five language models across different tasks related to Math, Code, and Vision. The data suggests that Kimi k1.5 long-CoT and OpenAI o1 are the top-performing models overall, while OpenAI o1-mini and QVQ-72B-Preview lag behind. The varying performance across different tasks highlights the importance of selecting the appropriate model for a specific application based on its strengths. The absence of QwQ-32B Preview in the Code and Vision categories suggests that this model may be specialized for Math-related tasks. The chart demonstrates the relative capabilities of these models on specific benchmarks, which can be valuable for developers and researchers in the field of artificial intelligence.