## Bar Chart: Model Performance Across Tasks
### Overview
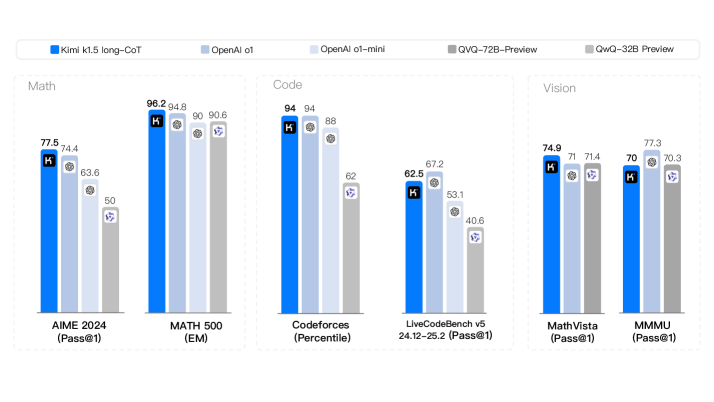
This image presents a bar chart comparing the performance of five different models – Kimi k1.5 long-CoT, OpenAI ot, OpenAI ot-mini, QVG-T2B-Preview, and QwQ-32B Preview – across six different tasks: MATH 2024, MATH 500, Codeforces, LiveCodeBench v5, Math Vista, and MMMU. Performance is measured using different metrics for each task (Pass@1, EM, Percentile). Each task has a set of bars representing the performance of each model.
### Components/Axes
* **X-axis:** Represents the six different tasks: MATH 2024 (Pass@1), MATH 500 (EM), Codeforces (Percentile), LiveCodeBench v5 (24.12-25.2) (Pass@1), Math Vista (Pass@1), MMMU (Pass@1).
* **Y-axis:** Represents the performance score, with a scale ranging from approximately 40 to 100. No explicit scale is provided, but values are displayed on top of each bar.
* **Legend (Top-Left):**
* Kimi k1.5 long-CoT (Blue)
* OpenAI ot (Light Blue)
* OpenAI ot-mini (Gray)
* QVG-T2B-Preview (Dark Gray)
* QwQ-32B Preview (Medium Gray)
### Detailed Analysis
Here's a breakdown of the performance for each task and model:
**1. MATH 2024 (Pass@1)**
* Kimi k1.5 long-CoT: 77.5
* OpenAI ot: 74.4
* OpenAI ot-mini: 63.6
* QVG-T2B-Preview: 50
* QwQ-32B Preview: ~50 (visually estimated)
**2. MATH 500 (EM)**
* Kimi k1.5 long-CoT: 96.2
* OpenAI ot: 94.8
* OpenAI ot-mini: 90.6
* QVG-T2B-Preview: ~90 (visually estimated)
* QwQ-32B Preview: ~90 (visually estimated)
**3. Codeforces (Percentile)**
* Kimi k1.5 long-CoT: 94
* OpenAI ot: 94
* OpenAI ot-mini: 88
* QVG-T2B-Preview: 62
* QwQ-32B Preview: ~62 (visually estimated)
**4. LiveCodeBench v5 (24.12-25.2) (Pass@1)**
* Kimi k1.5 long-CoT: 67.2
* OpenAI ot: 62.5
* OpenAI ot-mini: 53.1
* QVG-T2B-Preview: 40.6
* QwQ-32B Preview: ~40 (visually estimated)
**5. Math Vista (Pass@1)**
* Kimi k1.5 long-CoT: 74.9
* OpenAI ot: 71.4
* OpenAI ot-mini: 70
* QVG-T2B-Preview: ~70 (visually estimated)
* QwQ-32B Preview: 73.3
**6. MMMU (Pass@1)**
* Kimi k1.5 long-CoT: 70.3
* OpenAI ot: 70
* OpenAI ot-mini: ~70 (visually estimated)
* QVG-T2B-Preview: ~70 (visually estimated)
* QwQ-32B Preview: 77.3
### Key Observations
* Kimi k1.5 long-CoT consistently performs well across all tasks, often achieving the highest scores.
* OpenAI ot and OpenAI ot-mini generally perform similarly, with OpenAI ot slightly outperforming ot-mini in most cases.
* QVG-T2B-Preview and QwQ-32B Preview consistently show the lowest performance across most tasks.
* MATH 500 shows the highest overall scores, while LiveCodeBench v5 shows the lowest.
* The performance gap between models is most significant on the MATH 2024 and LiveCodeBench v5 tasks.
### Interpretation
The data suggests that Kimi k1.5 long-CoT is the most capable model across the evaluated tasks, demonstrating strong performance in both mathematical reasoning (MATH 2024, MATH 500, Math Vista) and code generation (Codeforces, LiveCodeBench v5). OpenAI's models exhibit solid performance, but generally lag behind Kimi k1.5 long-CoT. QVG-T2B-Preview and QwQ-32B Preview appear to be less effective on these benchmarks.
The varying performance across tasks indicates that different models excel in different areas. The high scores on MATH 500 suggest that the models are proficient in solving well-defined mathematical problems, while the lower scores on LiveCodeBench v5 suggest challenges in more complex code generation scenarios. The use of different metrics (Pass@1, EM, Percentile) makes direct comparison across tasks difficult, but the relative ranking of models within each task provides valuable insights. The "K" symbol on top of each bar likely indicates a statistical significance marker, but without further context, its meaning is unclear.