## Tree Diagram: State Exploration
### Overview
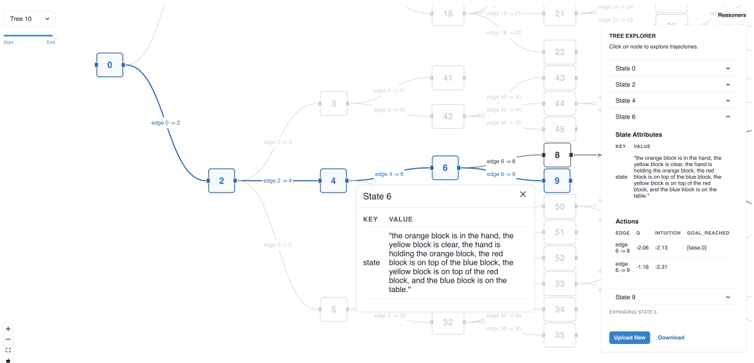
The image presents a tree diagram visualizing the exploration of states in a reasoning process. The diagram shows nodes representing states, connected by edges representing transitions between states. The diagram also includes a "Tree Explorer" panel, "State Attributes" and "Actions" panel, providing details about the selected state and actions taken.
### Components/Axes
* **Nodes:** Represent states in the reasoning process. Each node is labeled with a number (e.g., 0, 2, 4, 6, 8, 9).
* **Edges:** Represent transitions between states. Each edge is labeled with the transition (e.g., "edge 0 -> 2", "edge 2 -> 4", "edge 4 -> 6", "edge 6 -> 8", "edge 6 -> 9").
* **Tree Explorer (Right Panel):** A panel on the right side allows the user to select and explore different states in the tree. It lists states (State 0, State 2, State 4, State 6, State 9) and provides dropdown menus for each.
* **State Attributes (Right Panel):** Displays the attributes of the selected state. It shows a "KEY" and "VALUE" pair. For State 6, the value is: "the orange block is in the hand, the yellow block is clear, the hand is holding the orange block, the red block is on top of the blue block, the yellow block is on top of the red block, and the blue block is on the table."
* **Actions (Right Panel):** Displays the actions taken to transition between states. It shows "EDGE", "Q", "INTUITION", and "GOAL REACHED" values.
* edge 6 -> 8: Q = -2.06, INTUITION = 2.13, GOAL REACHED = [false, 0]
* edge 6 -> 9: Q = -1.16, INTUITION = -2.31
* **Tree 10 (Top-Left):** A dropdown menu labeled "Tree 10" is present in the top-left corner.
### Detailed Analysis or ### Content Details
* **State 0:** The starting state, connected to State 2 via "edge 0 -> 2".
* **State 2:** Connected to State 4 via "edge 2 -> 4".
* **State 4:** Connected to State 6 via "edge 4 -> 6".
* **State 6:** Connected to State 8 via "edge 6 -> 8" and to State 9 via "edge 6 -> 9".
* **State 8:** No outgoing edges are visible in the image.
* **State 9:** No outgoing edges are visible in the image.
* **Other States:** Several other states (e.g., 3, 5, 18, 21, 22, 32, 33, 34, 35, 41, 42, 43, 44, 45, 50, 51, 52) are present in the diagram but are less prominent and have faded lines.
### Key Observations
* The diagram visualizes a branching exploration of states, starting from State 0 and branching out to other states.
* The "Tree Explorer" panel allows users to navigate and examine the attributes and actions associated with each state.
* The "State Attributes" provide a textual description of the state.
* The "Actions" panel provides numerical values for "Q" and "INTUITION" associated with each transition.
### Interpretation
The diagram represents a decision-making or problem-solving process where different states are explored based on certain actions. The "Q" and "INTUITION" values likely represent some form of evaluation or prediction associated with each action. The "GOAL REACHED" value indicates whether a particular action led to the desired goal. The state attributes provide context and meaning to each state, allowing for a deeper understanding of the reasoning process. The tree structure shows how the process branches out as different options are considered. The faded lines and less prominent states suggest that some paths were explored but not pursued as deeply as others.