\n
## Diagram: State Transition Tree
### Overview
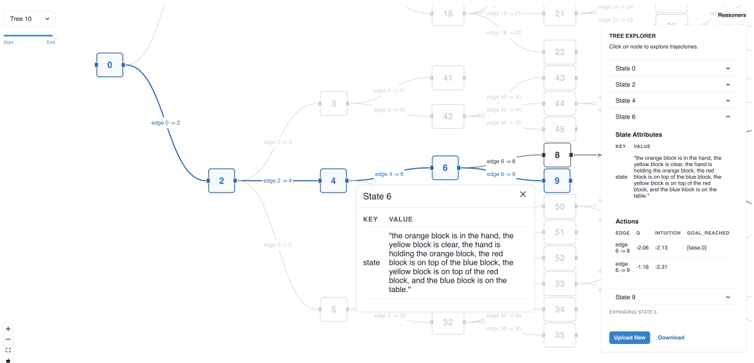
The image depicts a state transition tree representing a planning or reasoning process, likely in a robotics or AI context involving block manipulation. The tree shows a sequence of states (numbered 0-9, 18-22, 33-35, 41-45, 50-52) and transitions between them, labeled with "edge x -> y" indicating the action taken to move from state x to state y. The right side of the image contains a "TREE EXPLORER" panel with options to select states and view "State Attributes" and "Actions". There are two text boxes describing the state attributes for State 6 and State 9.
### Components/Axes
* **Nodes:** Represent states, depicted as squares with numbers inside.
* **Edges:** Represent transitions between states, labeled with "edge x -> y" and a numerical value.
* **TREE EXPLORER Panel:** Located on the right side, provides interactive access to state information.
* **State Selection:** Dropdown menu to select a state.
* **State Attributes:** Key-value pairs describing the state.
* **Actions:** Table listing actions, their associated edge, intuition, and goal reached.
* **State Attribute Text Boxes:** Two boxes describing the state attributes for State 6 and State 9.
### Detailed Analysis or Content Details
**Tree Structure:**
* **State 0:** The root node.
* **State 2:** Connected to State 0 via "edge 0 -> 2" with a value of 2.
* **State 4:** Connected to State 2 via "edge 2 -> 4" with a value of 2.
* **State 6:** Connected to State 4 via "edge 4 -> 6" with a value of 1.
* **State 9:** Connected to State 6 via "edge 6 -> 9" with a value of 8.
* **State 9:** Also connected to State 6 via "edge 6 -> 9" with a value of 9.
* **State 5:** Connected to State 4 via "edge 4 -> 5" with a value of 1.
* **States 18-22:** Branching from State 3, connected via "edge 3 -> x" with values 1, 1, 1, 1, 1.
* **States 33-35:** Branching from State 5, connected via "edge 5 -> x" with values 1, 1, 1.
* **States 41-45:** Branching from State 3, connected via "edge 3 -> x" with values 1, 1, 1, 1, 1.
* **States 50-52:** Branching from State 9, connected via "edge 9 -> x" with values 1, 1, 1.
**State Attributes (Transcribed):**
* **State 6:**
* KEY: VALUE
* "The orange block is in the hand, the yellow block is clear, the hand is holding the orange block, the red block is on top of the blue block, the yellow block is on top of the red block, and the blue block is on the table."
* **State 9:**
* KEY: VALUE
* "The orange block is in the hand, the yellow block is clear, the hand is holding the orange block, the red block is on top of the blue block, the yellow block is on top of the red block, and the blue block is on the table."
**Actions (Transcribed):**
* EDGE: 0
* INTUITION: 0.15
* GOAL REACHED: [None]
* EDGE: 8
* INTUITION: 0.21
* GOAL REACHED: [None]
* EDGE: 9
* INTUITION: 0.21
* GOAL REACHED: [None]
### Key Observations
* State 6 and State 9 have identical state attributes.
* The "edge" values represent the cost or probability of transitioning between states.
* The "TREE EXPLORER" panel suggests an interactive environment for exploring the state space.
* The state attributes describe a specific configuration of colored blocks.
* The intuition values are relatively low, suggesting uncertainty in the planning process.
### Interpretation
The diagram represents a planning process for manipulating colored blocks. The tree structure shows possible sequences of actions (edges) to reach different states. The state attributes describe the arrangement of the blocks at each state. The fact that State 6 and State 9 have the same attributes suggests that the two transitions "edge 6 -> 9" (with values 8 and 9) lead to the same outcome. The low intuition values indicate that the planner is not highly confident in its choices. The "TREE EXPLORER" panel suggests that a user can interactively explore the state space and examine the attributes and actions associated with each state. This is likely a visualization tool for a reinforcement learning or automated planning system. The system is attempting to achieve a goal state (likely the state described in State 6 or 9) by exploring different action sequences. The edge values likely represent the cost or probability of taking a particular action. The goal reached is currently set to none.