## State Transition Diagram / Tree Explorer Interface
### Overview
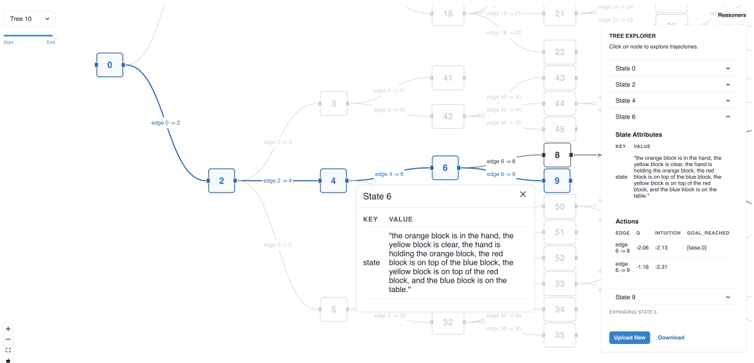
The image displays a software interface for visualizing and exploring a state transition tree, likely for a planning or reinforcement learning system. The interface is divided into three main regions: a large interactive tree diagram on the left, a "Tree Explorer" control panel on the right, and a pop-up detail window for "State 6" in the center. The system appears to model a task involving colored blocks (orange, yellow, red, blue) and their spatial relationships.
### Components/Axes
**1. Main Tree Diagram (Left & Center)**
* **Structure:** A directed graph (tree) with numbered nodes (states) connected by labeled edges (transitions).
* **Nodes:** Rectangular boxes containing state numbers. Visible nodes include: 0, 2, 3, 4, 5, 6, 8, 9, 18, 21, 22, 32, 33, 34, 35, 41, 42, 43, 44, 45, 50, 51, 52.
* **Edges:** Curved lines connecting nodes, labeled with transition names (e.g., `edge 0 -> 2`, `edge 2 -> 4`, `edge 4 -> 6`, `edge 6 -> 8`, `edge 6 -> 9`).
* **Active Path:** A highlighted path from node 0 to node 2 to node 4 to node 6, indicating the current or selected trajectory.
* **Pop-up Window (Center):** A modal titled "State 6" with a close button (X). It contains a table with two columns: `KEY` and `VALUE`.
* **Top-Left Control:** A dropdown menu labeled "Tree 10" with a slider below it (range appears to be 0 to 214).
**2. Tree Explorer Panel (Right)**
* **Header:** "TREE EXPLORER" with the instruction "Click on node to explore trajectories."
* **State Selector:** A dropdown menu currently showing "State 0". Other visible options in the list are State 2, State 4, State 6.
* **State Attributes Section:**
* **Header:** "State Attributes"
* **Content:** A text block describing the state. The text is identical to the `VALUE` for the `state` key in the State 6 pop-up.
* **Actions Section:**
* **Header:** "Actions"
* **Table Columns:** `EDGE`, `INTUITION`, `GOAL REACHED`
* **Table Rows:**
* `edge 6 -> 8`: `INTUITION` = -0.88, `GOAL REACHED` = [False]
* `edge 6 -> 9`: `INTUITION` = -1.16, `GOAL REACHED` = [False]
* **Footer Controls:**
* A dropdown labeled "State 9" with the text "EXPLORING STATE 6" below it.
* Two buttons: "Upload Tree" and "Download".
**3. Additional UI Elements**
* **Top-Right Corner:** A link labeled "Resources".
* **Bottom-Left Corner:** Zoom controls (+ and - buttons).
### Detailed Analysis
**State 6 Pop-up Content (Transcribed):**
| KEY | VALUE |
| :--- | :--- |
| state | "The orange block is in the hand, the yellow block is on the table, the hand is holding the orange block, the red block is on the table, the blue block is on the table, the yellow block is on top of the red block, and the blue block is on the table." |
**Tree Explorer Panel - State Attributes (Transcribed):**
The text under "State Attributes" is an exact copy of the `VALUE` for the `state` key from the State 6 pop-up.
**Tree Explorer Panel - Actions Table (Transcribed):**
| EDGE | INTUITION | GOAL REACHED |
| :--- | :--- | :--- |
| edge 6 -> 8 | -0.88 | [False] |
| edge 6 -> 9 | -1.16 | [False] |
**Tree Structure & Flow:**
* The tree originates at **State 0**.
* A primary path flows: **0 → 2 → 4 → 6**.
* From **State 6**, the tree branches into two transitions: to **State 8** and **State 9**.
* The tree expands significantly from other nodes (e.g., from State 2 to State 3, from State 4 to State 5, and from State 6 to a large cluster including States 18, 21, 22, 32-35, 41-45, 50-52), indicating a complex state space.
### Key Observations
1. **State Description Complexity:** The description for State 6 is verbose and contains a redundant clause ("the blue block is on the table" is stated twice). This may be an artifact of automated state description generation.
2. **Negative Intuition Values:** The "INTUITION" values for actions from State 6 are negative (-0.88 and -1.16). In many planning/RL contexts, this could indicate a low estimated value or high cost for those transitions.
3. **No Goal Reached:** Both available actions from State 6 lead to states where the goal is not reached (`[False]`).
4. **Asymmetric Branching:** The transition from State 6 to State 8 has a slightly higher (less negative) intuition value than the transition to State 9, suggesting it might be marginally preferred by the system's policy.
5. **Interface Purpose:** The interface is designed for interactive exploration, allowing a user to click nodes to see their attributes and available actions, and to visualize the resulting trajectory in the tree.
### Interpretation
This image captures a snapshot of a **state-space exploration tool for a block-manipulation task**. The system is modeling a scenario where an agent must manipulate colored blocks to achieve a goal configuration.
* **What the data suggests:** The agent is currently in a state (State 6) where it is holding an orange block, with a yellow block stacked on a red block, and a blue block separate on the table. From this state, it has two possible actions (edges to State 8 and State 9), but the system's internal "intuition" (likely a value function or policy score) rates both as suboptimal (negative values), and neither leads directly to the goal.
* **How elements relate:** The tree diagram visualizes the consequence of actions. The "Tree Explorer" panel provides the semantic meaning (state description) and quantitative evaluation (intuition, goal status) for the selected node and its outgoing edges. The pop-up offers a focused view of the selected node's data.
* **Notable patterns/anomalies:** The primary anomaly is the redundant text in the state description. The key pattern is the branching decision point at State 6, where the system must choose between two seemingly poor options. The large, unexplored branches of the tree (e.g., from State 2, 4, 6) indicate a vast potential state space that the current trajectory has not yet visited. The tool is essential for diagnosing the agent's decision-making process at critical junctures.