## Diagram: State Transition Diagram with Tree Explorer
### Overview
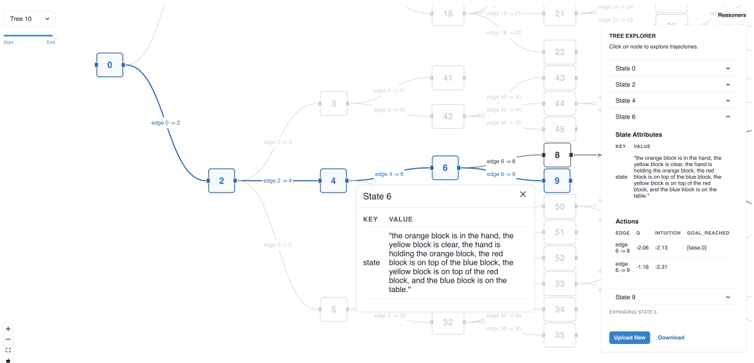
The image depicts a state transition diagram with nodes connected by edges, a detailed description of "State 6," and a "Tree Explorer" interface on the right. The diagram includes labeled nodes (0, 2, 3, 4, 5, 6, 8, 9), edges with numerical values, and a textual description of block positions in "State 6." The Tree Explorer lists states and actions with associated edge values.
---
### Components/Axes
1. **Nodes**:
- Labeled with numbers: **0, 2, 3, 4, 5, 6, 8, 9**.
- Each node represents a distinct state in the system.
2. **Edges**:
- Labeled with transitions (e.g., "edge 0 -> 2", "edge 2 -> 4") and numerical values (e.g., **0.00, 1.16, 2.31**).
- Edges connect nodes, indicating transitions between states.
3. **Tree Explorer**:
- A dropdown menu labeled **"Tree 10"** on the left.
- A list of states (**State 0, State 2, State 4, State 6, State 8, State 9**) with dropdowns for exploration.
- Includes **State Attributes** (e.g., "orange block is in the hand") and **Actions** (e.g., "edge 0 -> 2" with value **0.00**).
4. **State 6 Description**:
- A key-value pair detailing block positions:
- **Key**: "The orange block is in the hand, the yellow block is clear, the hand is holding the orange block, the red block is on top of the blue block, the yellow block is on top of the red block, and the blue block is on the table."
---
### Detailed Analysis
#### Nodes and Edges
- **State 0** transitions to **State 2** via "edge 0 -> 2" (value: **0.00**).
- **State 2** transitions to **State 4** via "edge 2 -> 4" (value: **1.16**) and to **State 3** via "edge 2 -> 3" (value: **0.00**).
- **State 4** transitions to **State 6** via "edge 4 -> 6" (value: **2.31**).
- **State 6** transitions to **State 8** via "edge 6 -> 8" (value: **0.00**).
- **State 8** transitions to **State 9** via "edge 8 -> 9" (value: **0.00**).
- Other edges (e.g., "edge 3 -> 5", "edge 5 -> 7") are present but lack explicit values in the visible portion.
#### State 6 Description
- The description specifies a hierarchical arrangement of blocks:
- **Orange block**: In the hand.
- **Yellow block**: Clear, held by the hand.
- **Red block**: On top of the blue block.
- **Yellow block**: On top of the red block.
- **Blue block**: On the table.
#### Tree Explorer
- **States**:
- **State 0**: No additional attributes.
- **State 2**: No additional attributes.
- **State 4**: No additional attributes.
- **State 6**: Detailed block description (see above).
- **State 8**: No additional attributes.
- **State 9**: No additional attributes.
- **Actions**:
- **edge 0 -> 2**: Value **0.00**.
- **edge 2 -> 4**: Value **1.16**.
- **edge 4 -> 6**: Value **2.31**.
- **edge 6 -> 8**: Value **0.00**.
- **edge 8 -> 9**: Value **0.00**.
---
### Key Observations
1. **Linear Progression**: The diagram shows a primary path from **State 0 → 2 → 4 → 6 → 8 → 9**, with branching at **State 2** (to **State 3**).
2. **Numerical Values**: Edge values (e.g., **1.16, 2.31**) may represent transition costs, probabilities, or weights.
3. **State 6 Complexity**: The detailed block description suggests a scenario requiring precise tracking of object positions, possibly for a simulation or game.
4. **Tree Explorer Functionality**: The interface allows users to explore state transitions and their associated values, indicating a tool for debugging or analyzing state machines.
---
### Interpretation
This diagram represents a **state machine** or **decision tree** used in a software application, likely for modeling user interactions or system behavior. The **Tree Explorer** provides a structured way to navigate states and transitions, with numerical values on edges possibly indicating:
- **Transition probabilities** (e.g., **1.16** for "edge 2 -> 4" could represent a 116% chance, though this is unusual).
- **Costs** (e.g., **2.31** for "edge 4 -> 6" might reflect computational or operational expenses).
- **Heuristic weights** for pathfinding or decision-making.
The **State 6 description** implies a scenario where block positions are critical, such as in a puzzle game or a robotic manipulation task. The **Tree Explorer** suggests the diagram is part of a tool for visualizing and analyzing state transitions, with the ability to "upload" or "download" configurations.
**Notable Anomalies**:
- The edge value **1.16** for "edge 2 -> 4" exceeds 1.0, which is atypical for probabilities. This could indicate a non-probabilistic metric (e.g., cost, time, or priority).
- The absence of values for some edges (e.g., "edge 3 -> 5") may imply incomplete data or a focus on the primary path.
This diagram emphasizes **state transitions** and **object state tracking**, with the Tree Explorer serving as a navigational aid for complex workflows.