## Chart: Open-loop pulsed programming of the CMO-HfOx ReRAM array
### Overview
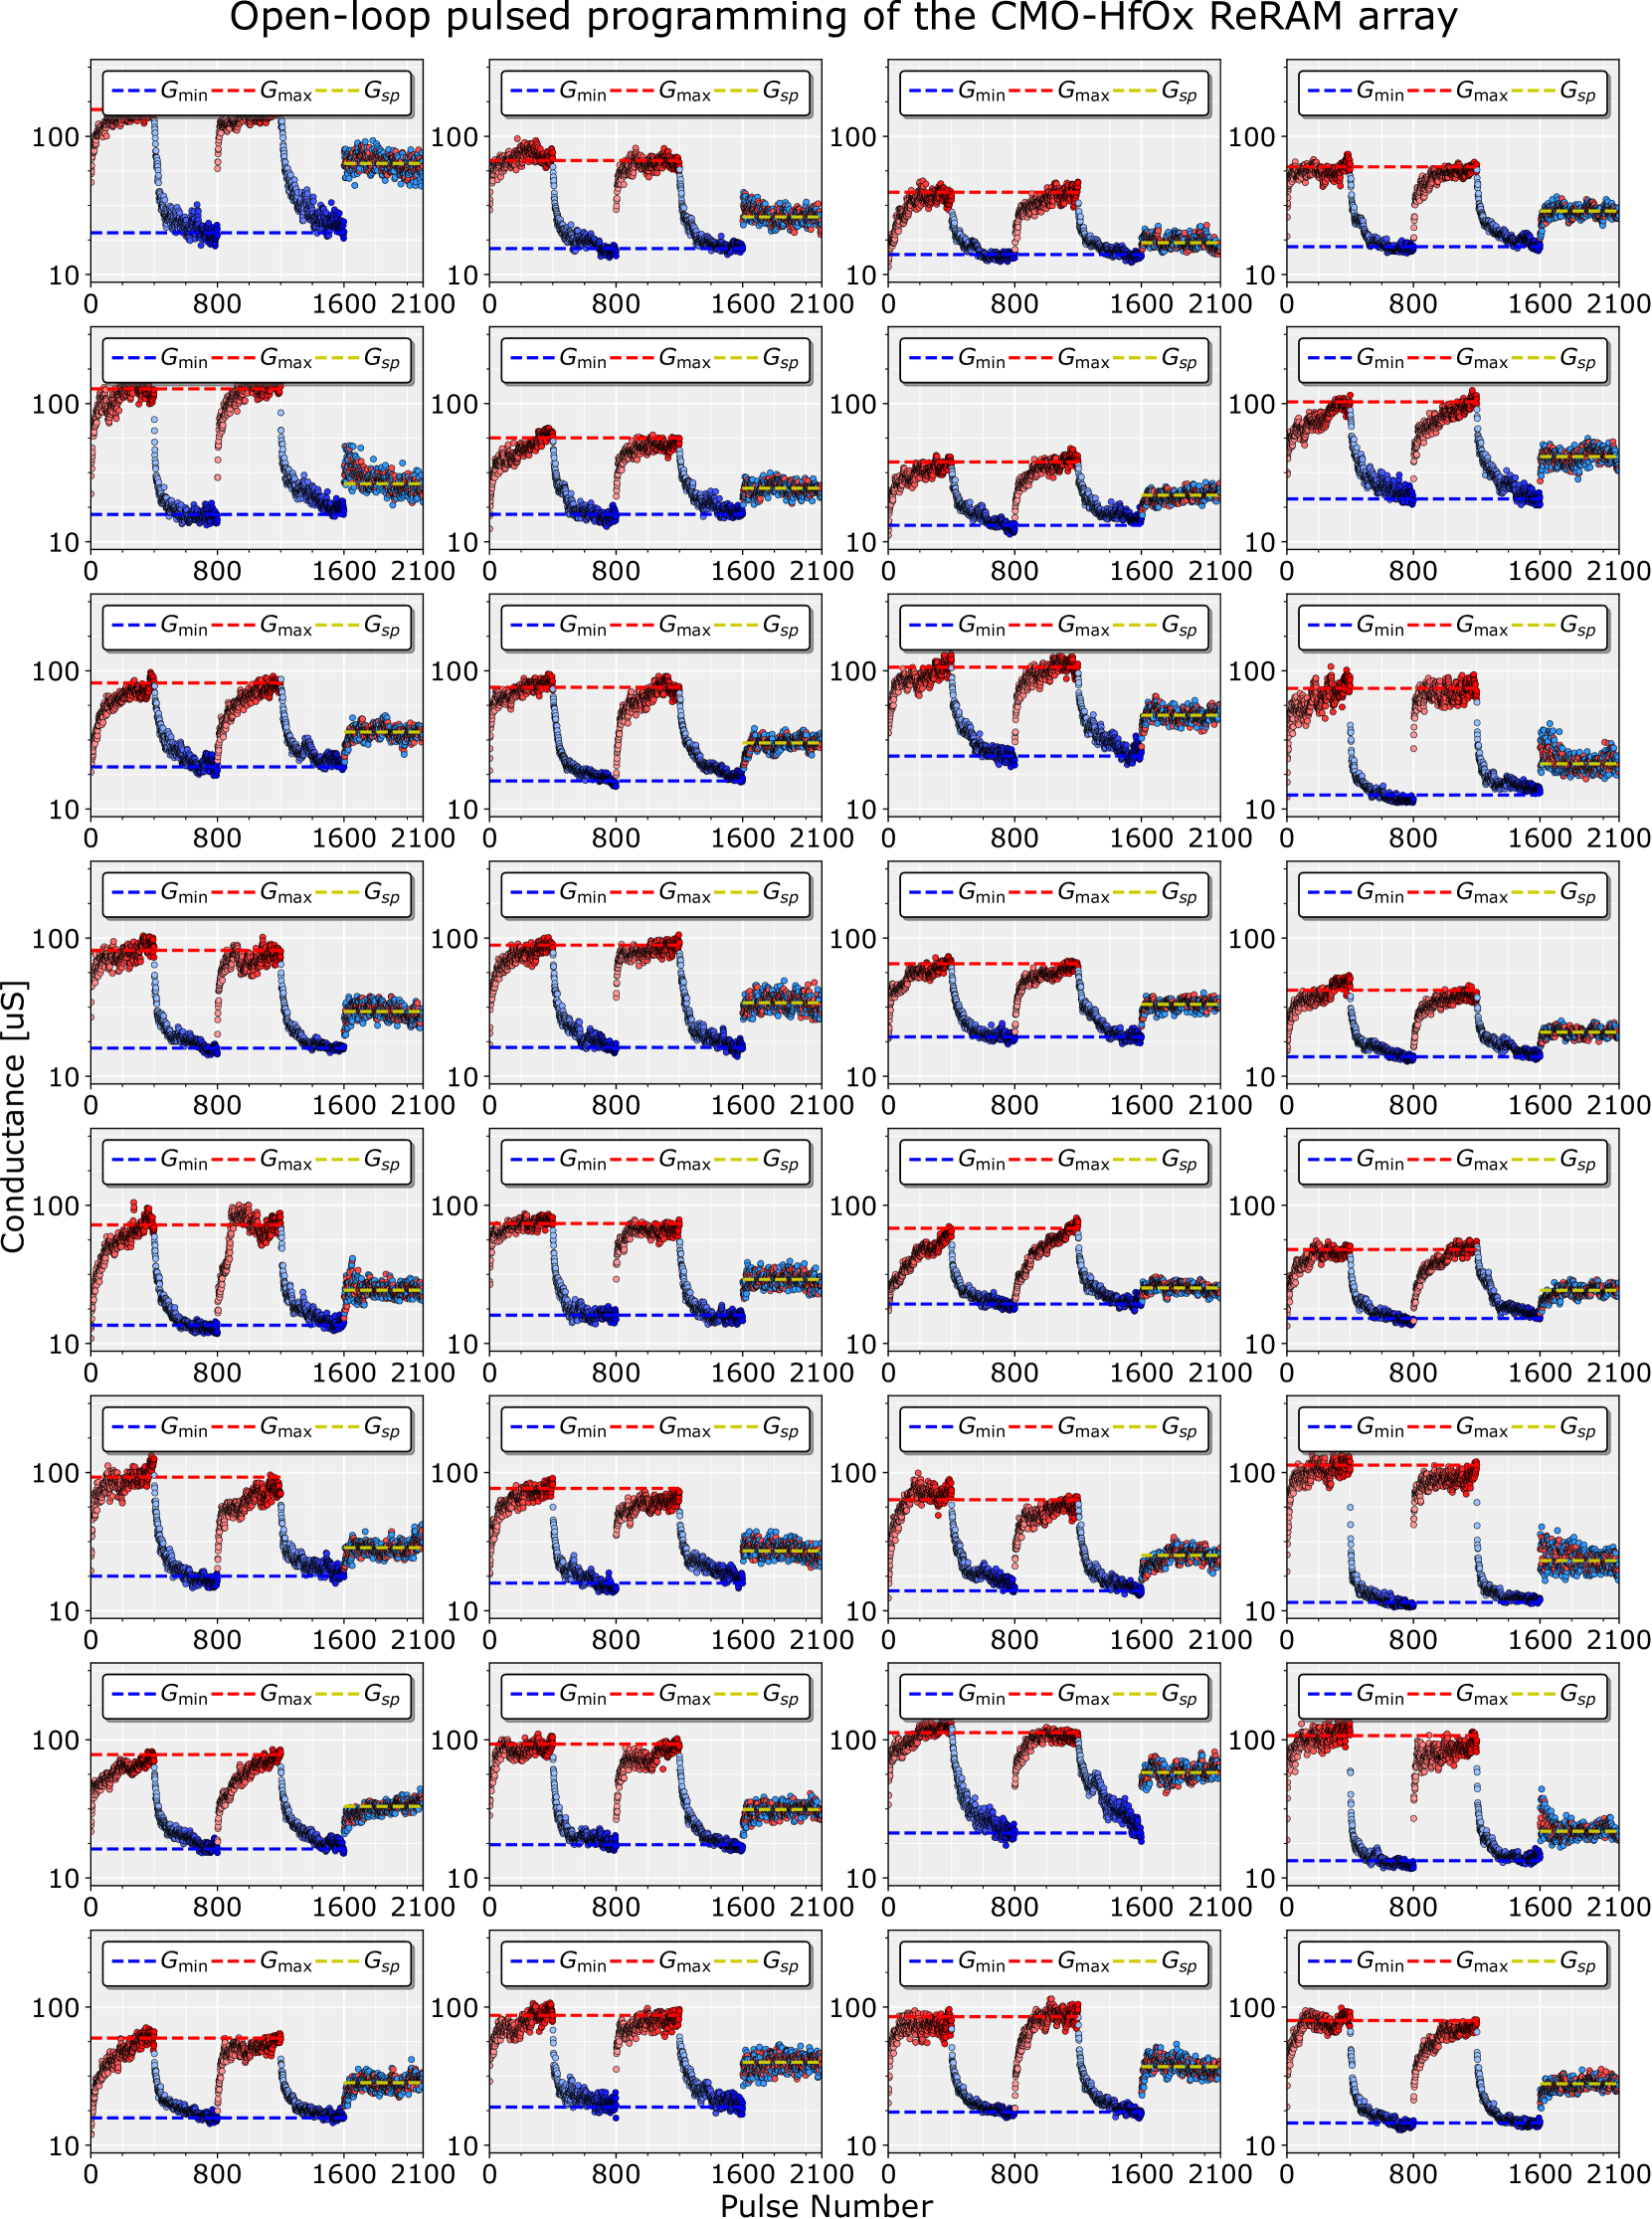
The image presents a series of 30 plots arranged in a 6x5 grid, each displaying the conductance (in uS) of a CMO-HfOx ReRAM array element as a function of the pulse number. Each plot shows a similar trend: the conductance starts at a high level, drops to a lower level after a number of pulses, and then returns to a stable intermediate level. The plots also include horizontal dashed lines representing Gmin, Gmax, and Gsp.
### Components/Axes
* **Title:** Open-loop pulsed programming of the CMO-HfOx ReRAM array
* **Y-axis:** Conductance [uS]. The scale is logarithmic, ranging from 10 to 100.
* **X-axis:** Pulse Number. The scale is linear, ranging from 0 to 2100, with major ticks at 0, 800, 1600, and 2100.
* **Legend:** Located at the top of each subplot.
* Gmin: Blue dashed line
* Gmax: Red dashed line
* Gsp: Yellow dashed line
### Detailed Analysis
Each of the 30 subplots displays a similar trend. The conductance starts near the Gmax level (red dashed line), then drops rapidly to near the Gmin level (blue dashed line) after a number of pulses (approximately 800). After more pulses (approximately 1600), the conductance stabilizes near the Gsp level (yellow dashed line).
* **Gmin:** The blue dashed line is consistently around 10 uS.
* **Gmax:** The red dashed line is consistently around 100 uS.
* **Gsp:** The yellow dashed line is consistently between 20 and 40 uS.
The data points are represented by circles, with color varying from red to blue, indicating the change in conductance.
### Key Observations
* The conductance switching behavior is consistent across all 30 ReRAM array elements.
* The switching occurs in two distinct phases: a rapid drop from Gmax to Gmin, followed by a stabilization at Gsp.
* There is some variability in the exact number of pulses required for the initial drop in conductance.
### Interpretation
The data suggests that the CMO-HfOx ReRAM array exhibits reliable and repeatable switching behavior under open-loop pulsed programming. The consistent trends across all 30 elements indicate uniformity in the device characteristics. The two-phase switching behavior may be related to different physical mechanisms involved in the conductance change. The Gsp level represents a stable intermediate state that the device settles into after the initial switching event. The variability in the number of pulses required for the initial drop could be due to slight variations in the device fabrication or operating conditions.