## Line Chart: Benchmark: OlympiadBench
### Overview
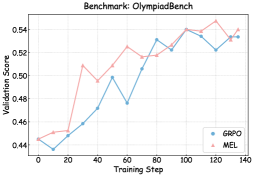
The chart compares the validation scores of two methods, GRPO and MEL, across training steps (0–140) on the OlympiadBench benchmark. Both lines show an upward trend, with GRPO (blue) and MEL (pink) converging at higher scores as training progresses.
### Components/Axes
- **X-axis (Training Step)**: Labeled "Training Step," with markers at 0, 20, 40, 60, 80, 100, 120, and 140.
- **Y-axis (Validation Score)**: Labeled "Validation Score," ranging from 0.44 to 0.54 in increments of 0.02.
- **Legend**: Located in the bottom-right corner, associating:
- **Blue circles**: GRPO
- **Pink triangles**: MEL
### Detailed Analysis
#### GRPO (Blue Line)
- **Trend**: Starts at 0.44 (step 0), dips to 0.43 (step 10), then rises steadily to 0.53 (step 100), fluctuates slightly, and stabilizes near 0.53–0.54 by step 140.
- **Key Data Points**:
- Step 0: 0.44
- Step 10: 0.43
- Step 20: 0.45
- Step 40: 0.47
- Step 60: 0.48
- Step 80: 0.53
- Step 100: 0.54
- Step 120: 0.53
- Step 140: 0.53
#### MEL (Pink Line)
- **Trend**: Begins at 0.44 (step 0), rises sharply to 0.51 (step 20), fluctuates between 0.50–0.54, peaks at 0.55 (step 120), then dips slightly to 0.54 (step 140).
- **Key Data Points**:
- Step 0: 0.44
- Step 10: 0.45
- Step 20: 0.51
- Step 40: 0.49
- Step 60: 0.52
- Step 80: 0.52
- Step 100: 0.54
- Step 120: 0.55
- Step 140: 0.54
### Key Observations
1. **Initial Divergence**: MEL starts with a sharper increase than GRPO (e.g., 0.44 → 0.51 at step 20 vs. GRPO’s 0.44 → 0.45).
2. **Convergence**: Both methods plateau near 0.53–0.54 by step 100, with MEL briefly exceeding GRPO at step 120 (0.55 vs. 0.53).
3. **Volatility**: MEL exhibits more fluctuations (e.g., drop from 0.54 to 0.52 at step 80), while GRPO shows steadier growth.
4. **Final Scores**: At step 140, both methods achieve ~0.53–0.54, with MEL marginally higher.
### Interpretation
The data suggests that both GRPO and MEL improve validation performance with training, but MEL demonstrates higher variability and occasional peaks. The convergence at later steps implies similar efficacy for complex tasks, though MEL’s transient superiority at step 120 may indicate sensitivity to specific training dynamics. The initial dip in GRPO’s score (step 10) could reflect an adaptation phase. Overall, the chart highlights trade-offs between stability (GRPO) and exploratory performance (MEL) in optimization benchmarks.