## Line Chart: Benchmark: OlympiadBench
### Overview
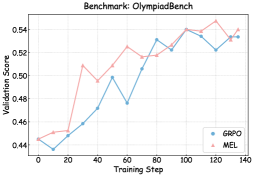
The image is a line chart comparing the validation scores of two models, GRPO and MEL, over training steps. The chart displays the performance of each model as training progresses, allowing for a visual comparison of their learning curves.
### Components/Axes
* **Title:** Benchmark: OlympiadBench
* **X-axis:** Training Step (ranging from 0 to 140, with increments of 20)
* **Y-axis:** Validation Score (ranging from 0.44 to 0.54, with increments of 0.02)
* **Legend:** Located in the bottom-right corner.
* GRPO (blue line with circle markers)
* MEL (pink line with triangle markers)
### Detailed Analysis
* **GRPO (blue line):**
* Trend: Generally increasing with fluctuations.
* Data Points:
* Training Step 0: Validation Score ~0.445
* Training Step 20: Validation Score ~0.435
* Training Step 40: Validation Score ~0.47
* Training Step 60: Validation Score ~0.50
* Training Step 80: Validation Score ~0.52
* Training Step 100: Validation Score ~0.54
* Training Step 120: Validation Score ~0.525
* Training Step 140: Validation Score ~0.535
* **MEL (pink line):**
* Trend: Generally increasing with fluctuations.
* Data Points:
* Training Step 0: Validation Score ~0.445
* Training Step 20: Validation Score ~0.45
* Training Step 40: Validation Score ~0.50
* Training Step 60: Validation Score ~0.53
* Training Step 80: Validation Score ~0.52
* Training Step 100: Validation Score ~0.54
* Training Step 120: Validation Score ~0.55
* Training Step 140: Validation Score ~0.53
### Key Observations
* Both models show an overall increasing trend in validation score as the training step increases.
* MEL appears to have a slightly higher validation score than GRPO at several points, particularly around training step 120.
* Both models exhibit fluctuations in their validation scores, indicating some variability in their learning process.
### Interpretation
The chart illustrates the learning curves of the GRPO and MEL models on the OlympiadBench benchmark. The increasing validation scores suggest that both models are learning effectively as training progresses. The fluctuations in the curves may indicate sensitivity to specific training examples or the need for further optimization. The slightly higher validation scores of MEL at certain points suggest that it may be a more effective model for this particular benchmark, although the difference is not substantial. Further analysis, including statistical significance testing, would be needed to confirm this.