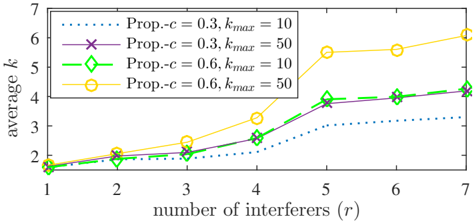
## Line Graph: Average k vs. Number of Interferers (r)
### Overview
The image is a line graph comparing the relationship between the number of interferers (r) and the average value of k across four distinct scenarios defined by propagation coefficient (Prop.-c) and maximum k (k_max). The graph uses four distinct line styles and markers to differentiate the scenarios.
### Components/Axes
- **X-axis**: "number of interferers (r)" with integer values from 1 to 7.
- **Y-axis**: "average k" with a scale from 1 to 7.
- **Legend**: Located in the top-left corner, with four entries:
1. **Dotted blue line**: Prop.-c = 0.3, k_max = 10 (marked with "x").
2. **Purple dashed line**: Prop.-c = 0.3, k_max = 50 (marked with "x").
3. **Green dash-dot line**: Prop.-c = 0.6, k_max = 10 (marked with "□").
4. **Yellow solid line**: Prop.-c = 0.6, k_max = 50 (marked with "○").
### Detailed Analysis
1. **Dotted Blue Line (Prop.-c = 0.3, k_max = 10)**:
- Starts at (1, 1.8) and increases linearly to (7, 3.2).
- Slope: ~0.2 per unit increase in r.
2. **Purple Dashed Line (Prop.-c = 0.3, k_max = 50)**:
- Starts at (1, 1.9) and increases linearly to (7, 4.1).
- Slope: ~0.4 per unit increase in r.
3. **Green Dash-Dot Line (Prop.-c = 0.6, k_max = 10)**:
- Starts at (1, 1.7) and increases linearly to (7, 4.0).
- Slope: ~0.4 per unit increase in r.
4. **Yellow Solid Line (Prop.-c = 0.6, k_max = 50)**:
- Starts at (1, 1.6) and increases linearly to (7, 6.2).
- Slope: ~0.7 per unit increase in r.
### Key Observations
- **Trend**: All lines show a positive correlation between the number of interferers (r) and average k.
- **Impact of k_max**: Higher k_max values (50 vs. 10) result in significantly higher average k across all r values.
- **Impact of Prop.-c**: Higher Prop.-c (0.6 vs. 0.3) increases average k, especially at larger r values.
- **Steepest Growth**: The yellow line (Prop.-c = 0.6, k_max = 50) exhibits the steepest slope, indicating the strongest sensitivity to interferers.
### Interpretation
The graph demonstrates that both the propagation coefficient (Prop.-c) and the maximum k (k_max) are critical factors in determining the average k in the presence of interferers. Higher values of Prop.-c and k_max mitigate the negative effects of interferers, with k_max having a more pronounced impact. For example:
- At r = 7, the yellow line (Prop.-c = 0.6, k_max = 50) reaches an average k of ~6.2, while the dotted blue line (Prop.-c = 0.3, k_max = 10) only reaches ~3.2.
- The purple and green lines (same Prop.-c but differing k_max) show that increasing k_max from 10 to 50 improves performance by ~1.1 units at r = 7.
This suggests that optimizing k_max is more effective than adjusting Prop.-c for improving system performance under interference. The linear trends imply a predictable relationship between these variables, which could inform resource allocation or interference management strategies in network systems.