\n
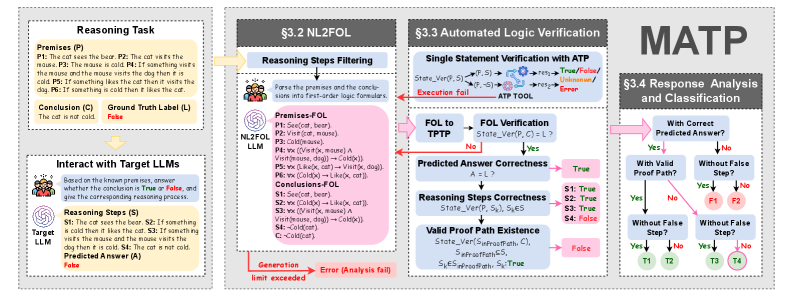
## Diagram: MATP - Multi-hop Automated Theorem Proving
### Overview
The image presents a diagram outlining the Multi-hop Automated Theorem Proving (MATP) framework. It details the process from a reasoning task, through Natural Language to First-Order Logic (NL2FOL) conversion, automated logic verification, and finally, response analysis and classification. The diagram is divided into four main sections, visually separated by distinct backgrounds and titles.
### Components/Axes
The diagram consists of four main sections:
1. **Reasoning Task:** Presents premises and a conclusion, along with a ground truth label.
2. **§3.2 NL2FOL:** Details the process of converting natural language premises and conclusions into First-Order Logic (FOL).
3. **§3.3 Automated Logic Verification:** Illustrates the verification process using ATP (Automated Theorem Provers).
4. **§3.4 Response Analysis and Classification:** Shows the analysis of predicted answers and the identification of valid proof paths.
Each section contains text boxes, flowcharts, and logical statements. The diagram uses color-coding to represent different outcomes (e.g., green for success, red for failure).
### Detailed Analysis or Content Details
**1. Reasoning Task (Leftmost Section):**
* **Title:** Reasoning Task
* **Premises (P1-P6):**
* P1: The cat sees the bear.
* P2: The mouse is cold.
* P3: If something hits the mouse and the mouse vents then it is cold.
* P4: If something hits the cat then it wants the dog.
* P5: If something is cold then it likes the dog.
* P6: Something hits the cat.
* **Conclusion (C):** The cat is not cold.
* **Ground Truth Label (L):** False.
* **Interact with Target LLMs:** Text states "Based on the known premises, answer whether the conclusion is True or False, and give the corresponding reasoning process."
* **Reasoning Steps (S):**
* S1: The cat sees the bear.
* S2: If something hits the cat then it wants the dog.
* S3: Something hits the cat.
* S4: The cat wants the dog.
* S5: If something is cold then it likes the dog.
* **Predicted Answer (A):** The cat is not cold.
* **Predicted Answer Label:** False.
**2. §3.2 NL2FOL (Top-Center Section):**
* **Title:** §3.2 NL2FOL
* **Sub-Title:** Reasoning Steps Filtering
* **Text:** "Parse the premises and the conclusions into first-order logic formulas."
* **Premises/FOL:**
* P1: See(cat, bear)
* P2: Cold(mouse)
* P3: ∃x(Hit(x, mouse) ∧ Vent(x, mouse) → Cold(x))
* P4: ∃x(Hit(x, cat) → Want(x, dog))
* P5: ∃x(Cold(x) → Like(x, dog))
* P6: Hit(x, cat)
* **Conclusions/FOL:**
* C: ¬Cold(cat)
* **LLM Generation:** Text states "Generate the corresponding reasoning path."
**3. §3.3 Automated Logic Verification (Right-Center Section):**
* **Title:** §3.3 Automated Logic Verification
* **Text:** "Single Statement Verification with ATP"
* **Flowchart:**
* FOL to TPTP: FOL → TPTP
* Execution: ATP Tool
* State_Verif(P, S) → {True/False/Unknown}
* Execution Fail → ATP Tool
* **Predicted Answer Correctness:** A = ? → True
* **Reasoning Steps Correctness:** State_Verif(P, S, S) = ? → {S1: True, S2: True, S3: True, S4: False}
* **Valid Proof Path Existence:** State_Verif(S1, S2, S3, S4) → False
* **sk(s)≠north:** S4: True
**4. §3.4 Response Analysis and Classification (Bottom-Right Section):**
* **Title:** §3.4 Response Analysis and Classification
* **Question:** "With Correct Predicted Answer?"
* **Flowchart:**
* Yes → "With Valid Proof Path?"
* Yes → T1
* No → F1
* No → "Without False Step?"
* Yes → T2
* No → F2
* "Without False Step?"
* Yes → T3
* No → F3
* "Without False Step?"
* Yes → T4
* No → F4
The flowchart shows four possible outcomes: T1, F1, T2, F2, T3, F3, T4, and F4, representing different combinations of correct/incorrect predictions and valid/invalid proof paths.
### Key Observations
* The diagram illustrates a pipeline for automated reasoning, starting from natural language input and ending with a classified response.
* The use of First-Order Logic (FOL) as an intermediate representation allows for formal verification using ATP tools.
* The flowchart in the Response Analysis section highlights the importance of both the correctness of the predicted answer and the validity of the reasoning steps.
* The diagram shows that the reasoning steps S1, S2, and S3 are considered correct, but S4 is incorrect, leading to a false conclusion regarding the existence of a valid proof path.
* The color-coding (green for true, red for false) provides a quick visual indication of the success or failure of each step.
### Interpretation
The diagram demonstrates a system designed to evaluate the reasoning capabilities of Large Language Models (LLMs). By translating natural language into formal logic, the system can rigorously verify the correctness of the LLM's conclusions and the validity of its reasoning steps. The classification scheme (T1-F4) provides a nuanced assessment of the LLM's performance, distinguishing between cases where the answer is correct due to a valid proof, incorrect due to a flawed proof, or incorrect despite a seemingly logical reasoning process. The diagram suggests that the system is capable of identifying subtle errors in reasoning, even when the initial premises and conclusions appear plausible. The failure in step S4 indicates a potential weakness in the LLM's ability to correctly apply logical rules or handle conditional statements. This framework is valuable for developing and evaluating LLMs that are capable of complex reasoning tasks. The diagram is a high-level overview of the MATP framework, and further details would be needed to understand the specific algorithms and techniques used in each step.