## Neural Network Training Diagram
### Overview
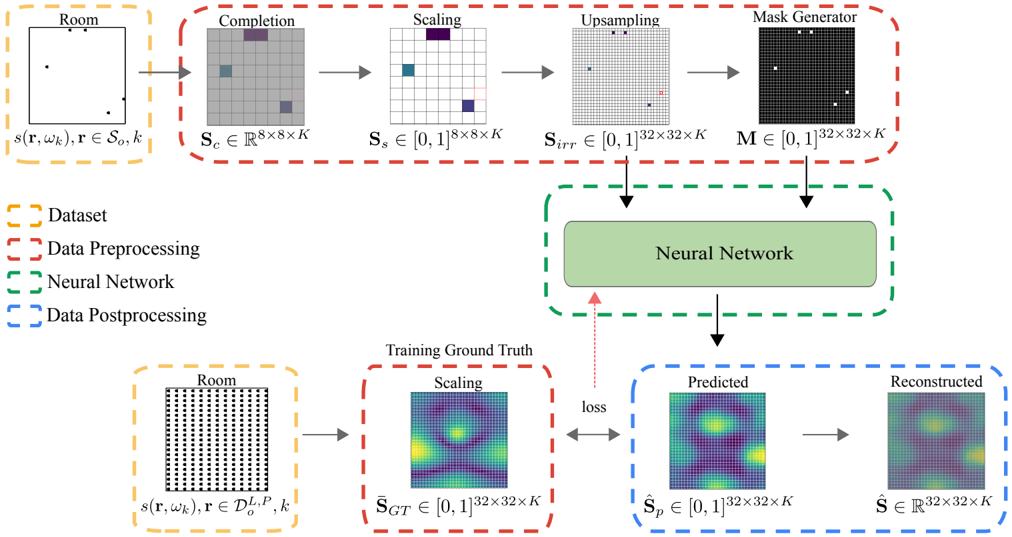
The image is a diagram illustrating the training process of a neural network. It shows the flow of data from the initial dataset through preprocessing steps, the neural network itself, and post-processing to generate predicted and reconstructed outputs, which are then compared to the training ground truth to calculate the loss.
### Components/Axes
* **Legend (Top-Left)**:
* Yellow dashed box: Dataset
* Red dashed box: Data Preprocessing
* Green dashed box: Neural Network
* Blue dashed box: Data Postprocessing
* **Dataset (Top-Left)**:
* Label: "Room"
* Equation: s(r, wk), r ∈ So, k
* Description: A diagram of a room with several black dots inside.
* **Data Preprocessing (Top)**:
* **Completion**:
* Label: "Completion"
* Equation: Sc ∈ R^(8x8xK)
* Description: An 8x8 grid with some squares colored gray, purple, and blue.
* **Scaling**:
* Label: "Scaling"
* Equation: Ss ∈ [0,1]^(8x8xK)
* Description: An 8x8 grid with some squares colored blue and purple.
* **Upsampling**:
* Label: "Upsampling"
* Equation: Sirr ∈ [0,1]^(32x32xK)
* Description: A 32x32 grid with some squares colored black and red.
* **Mask Generator**:
* Label: "Mask Generator"
* Equation: M ∈ [0,1]^(32x32xK)
* Description: A 32x32 black grid with several white squares.
* **Neural Network (Center)**:
* Label: "Neural Network"
* Description: A green rounded rectangle.
* **Training Ground Truth (Bottom-Center)**:
* Label: "Training Ground Truth"
* **Scaling**:
* Label: "Scaling"
* Equation: S_GT ∈ [0,1]^(32x32xK)
* Description: A 32x32 grid with a heatmap-like color distribution, ranging from blue to yellow.
* **Data Postprocessing (Bottom-Right)**:
* **Predicted**:
* Label: "Predicted"
* Equation: S_p ∈ [0,1]^(32x32xK)
* Description: A 32x32 grid with a heatmap-like color distribution, ranging from blue to yellow.
* **Reconstructed**:
* Label: "Reconstructed"
* Equation: Ŝ ∈ R^(32x32xK)
* Description: A 32x32 grid with a heatmap-like color distribution, ranging from blue to yellow.
* **Dataset (Bottom-Left)**:
* Label: "Room"
* Equation: s(r, wk), r ∈ D_o^(L,P), k
* Description: A diagram of a room filled with black dots.
* **Arrows**:
* Gray arrows indicate the flow of data.
* Red arrow indicates the "loss" feedback.
### Detailed Analysis or ### Content Details
The diagram illustrates the process of training a neural network to reconstruct a "room" representation. The process begins with an initial "Room" dataset, which is preprocessed through steps labeled "Completion", "Scaling", "Upsampling", and "Mask Generator". These steps transform the initial data into a format suitable for the neural network. The preprocessed data is then fed into the "Neural Network". The output of the neural network is post-processed into "Predicted" and "Reconstructed" representations. The "Predicted" output is compared to the "Training Ground Truth" to calculate the "loss", which is then used to update the neural network's parameters.
### Key Observations
* The data preprocessing steps involve transforming the initial room representation through a series of scaling and masking operations.
* The neural network aims to predict and reconstruct a target representation that matches the training ground truth.
* The loss function provides feedback to the neural network, guiding the learning process.
### Interpretation
The diagram depicts a typical neural network training pipeline. The "Room" dataset likely represents some form of spatial data or scene information. The preprocessing steps are designed to prepare this data for the neural network, potentially by filling in missing information ("Completion"), normalizing the data ("Scaling"), increasing the resolution ("Upsampling"), and focusing on relevant regions ("Mask Generator"). The neural network then learns to map this preprocessed input to a target representation, as defined by the "Training Ground Truth". The "loss" function quantifies the difference between the network's predictions and the ground truth, allowing the network to iteratively improve its performance. The "Reconstructed" output represents the network's attempt to recreate the original input from its learned representation.