## Horizontal Bar Chart: Ablation Study Results on Challenge Dataset
### Overview
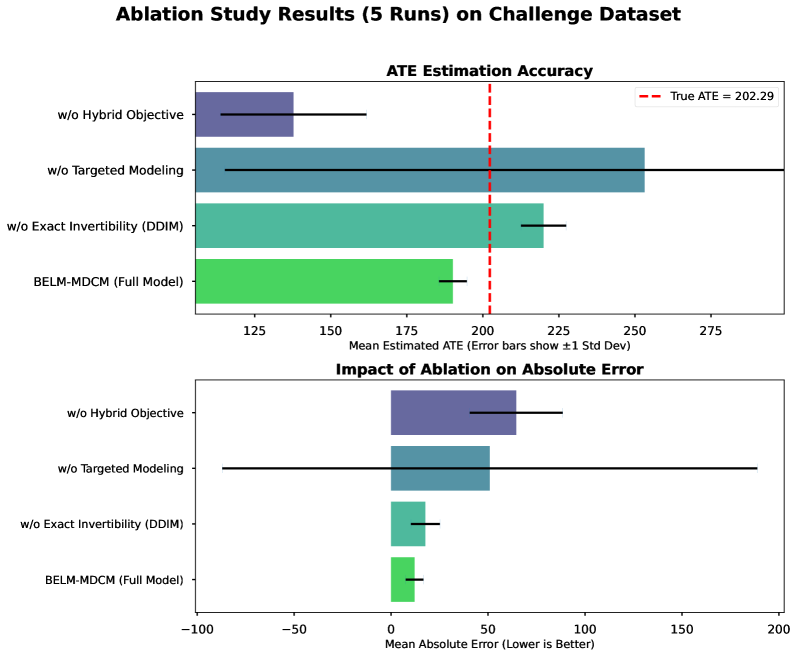
The image presents two horizontal bar charts displaying the results of an ablation study conducted on a challenge dataset. The study investigates the impact of removing different components from a model (BELM-MDCM) on two metrics: ATE (Average Treatment Effect) Estimation Accuracy and Absolute Error. The top chart shows the mean estimated ATE with error bars representing ±1 standard deviation, while the bottom chart shows the mean absolute error, also with error bars.
### Components/Axes
**Top Chart: ATE Estimation Accuracy**
* **Title:** ATE Estimation Accuracy
* **X-axis:** Mean Estimated ATE (Error bars show ±1 Std Dev)
* Scale: 125 to 275, with increments of 25.
* **Y-axis:** (Implicit) Categories representing different model configurations:
* w/o Hybrid Objective
* w/o Targeted Modeling
* w/o Exact Invertibility (DDIM)
* BELM-MDCM (Full Model)
* **Vertical Dashed Line:** Represents the "True ATE = 202.29"
**Bottom Chart: Impact of Ablation on Absolute Error**
* **Title:** Impact of Ablation on Absolute Error
* **X-axis:** Mean Absolute Error (Lower is Better)
* Scale: -100 to 200, with increments of 50.
* **Y-axis:** (Implicit) Categories representing different model configurations:
* w/o Hybrid Objective
* w/o Targeted Modeling
* w/o Exact Invertibility (DDIM)
* BELM-MDCM (Full Model)
### Detailed Analysis
**Top Chart: ATE Estimation Accuracy**
* **BELM-MDCM (Full Model):** The mean estimated ATE is approximately 195, with a standard deviation of approximately ±20.
* **w/o Exact Invertibility (DDIM):** The mean estimated ATE is approximately 210, with a standard deviation of approximately ±15.
* **w/o Targeted Modeling:** The mean estimated ATE is approximately 250, with a standard deviation of approximately ±30.
* **w/o Hybrid Objective:** The mean estimated ATE is approximately 140, with a standard deviation of approximately ±25.
**Bottom Chart: Impact of Ablation on Absolute Error**
* **BELM-MDCM (Full Model):** The mean absolute error is approximately 15, with a standard deviation of approximately ±10.
* **w/o Exact Invertibility (DDIM):** The mean absolute error is approximately 25, with a standard deviation of approximately ±10.
* **w/o Targeted Modeling:** The mean absolute error is approximately 45, with a standard deviation of approximately ±150.
* **w/o Hybrid Objective:** The mean absolute error is approximately 60, with a standard deviation of approximately ±25.
### Key Observations
* In the ATE Estimation Accuracy chart, removing the Hybrid Objective results in the lowest accuracy, while removing Targeted Modeling results in the highest.
* In the Absolute Error chart, the full model (BELM-MDCM) has the lowest error, indicating its superior performance. Removing the Hybrid Objective results in the highest error.
* The error bars (standard deviations) vary across the different model configurations, indicating varying levels of consistency in the results.
### Interpretation
The ablation study reveals the importance of each component of the BELM-MDCM model. Removing the Hybrid Objective significantly impacts both ATE estimation accuracy and absolute error, suggesting it is a crucial component. Removing Targeted Modeling improves ATE estimation accuracy but increases absolute error, indicating a trade-off. The full model (BELM-MDCM) achieves the lowest absolute error, demonstrating its overall effectiveness. The variations in standard deviations suggest that some ablations lead to more consistent results than others. The "True ATE" line in the top chart provides a benchmark for evaluating the accuracy of the ATE estimations.