## Ablation Study Results (5 Runs) on Challenge Dataset
### Overview
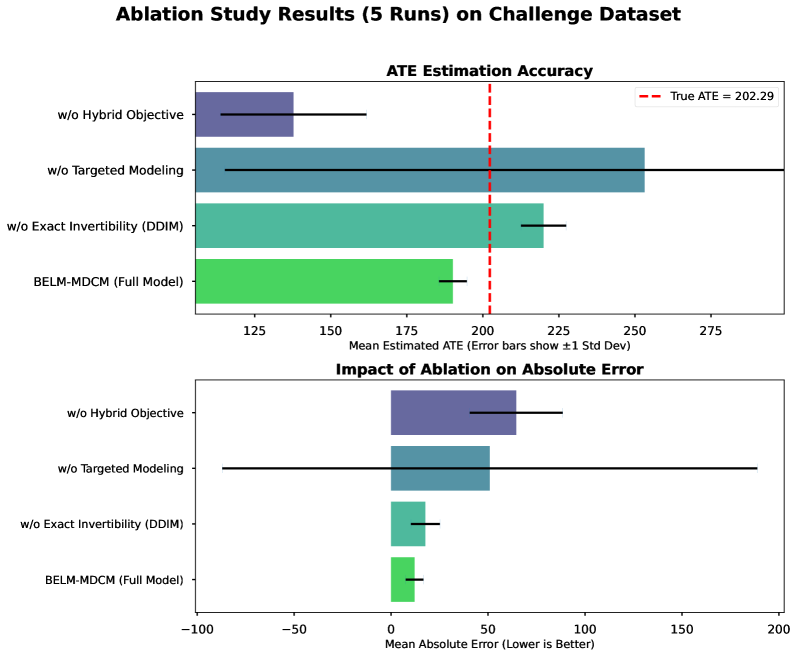
The image displays two horizontal bar charts presenting the results of an ablation study conducted over 5 runs on a "Challenge Dataset." The study evaluates the performance of a full model ("BELM-MDCM") against three variants where specific components have been removed ("w/o" meaning "without"). The top chart assesses the accuracy of Average Treatment Effect (ATE) estimation, while the bottom chart quantifies the impact of each ablation on the mean absolute error.
### Components/Axes
**Main Title:** "Ablation Study Results (5 Runs) on Challenge Dataset"
**Top Chart: ATE Estimation Accuracy**
* **Chart Type:** Horizontal bar chart with error bars.
* **Y-axis (Categories):** Four model variants, listed from top to bottom:
1. `w/o Hybrid Objective` (Dark purple bar)
2. `w/o Targeted Modeling` (Teal/blue-green bar)
3. `w/o Exact Invertibility (DDIM)` (Medium green bar)
4. `BELM-MDCM (Full Model)` (Bright green bar)
* **X-axis:** "Mean Estimated ATE (Error bars show ±1 Std Dev)". The scale runs from approximately 110 to 290, with major ticks at 125, 150, 175, 200, 225, 250, 275.
* **Legend/Reference Line:** A vertical, dashed red line is positioned at `x = 202.29`. The legend in the top-right corner labels this as `True ATE = 202.29`.
**Bottom Chart: Impact of Ablation on Absolute Error**
* **Chart Type:** Horizontal bar chart with error bars.
* **Y-axis (Categories):** The same four model variants as the top chart, in the same order and color scheme.
* **X-axis:** "Mean Absolute Error (Lower is Better)". The scale runs from -100 to 200, with major ticks at -100, -50, 0, 50, 100, 150, 200.
### Detailed Analysis
**Top Chart - ATE Estimation Accuracy:**
* **Trend Verification:** The "Full Model" bar is closest to the "True ATE" line. Removing components generally shifts the estimated ATE further away from the true value, with the exception of the "w/o Exact Invertibility" variant, which is closer than "w/o Targeted Modeling."
* **Data Points (Approximate Mean ± Std Dev):**
* `w/o Hybrid Objective`: Mean ≈ 135, Std Dev range ≈ 115 to 155.
* `w/o Targeted Modeling`: Mean ≈ 255, Std Dev range ≈ 115 to 295 (very large spread).
* `w/o Exact Invertibility (DDIM)`: Mean ≈ 215, Std Dev range ≈ 205 to 225.
* `BELM-MDCM (Full Model)`: Mean ≈ 190, Std Dev range ≈ 180 to 200.
**Bottom Chart - Impact of Ablation on Absolute Error:**
* **Trend Verification:** The "Full Model" has the shortest bar, indicating the lowest error. All ablated variants show increased error. The "w/o Targeted Modeling" variant has an exceptionally large error bar.
* **Data Points (Approximate Mean Absolute Error ± Std Dev):**
* `w/o Hybrid Objective`: Mean ≈ 65, Std Dev range ≈ 45 to 85.
* `w/o Targeted Modeling`: Mean ≈ 50, Std Dev range ≈ -90 to 190 (extremely large spread, indicating high instability).
* `w/o Exact Invertibility (DDIM)`: Mean ≈ 15, Std Dev range ≈ 5 to 25.
* `BELM-MDCM (Full Model)`: Mean ≈ 10, Std Dev range ≈ 5 to 15.
### Key Observations
1. **Full Model Superiority:** The `BELM-MDCM (Full Model)` consistently performs best, achieving an estimated ATE closest to the true value (202.29) and the lowest mean absolute error.
2. **Critical Component:** Removing "Targeted Modeling" (`w/o Targeted Modeling`) causes the most severe degradation in performance. It results in the largest overestimation of the ATE (mean ~255) and exhibits extremely high variance (very long error bars in both charts), suggesting this component is crucial for both accuracy and stability.
3. **Stability vs. Accuracy:** The `w/o Exact Invertibility (DDIM)` variant shows relatively good accuracy (mean ATE ~215) and low variance, but its absolute error is still higher than the full model. This suggests the DDIM component contributes to fine-tuning accuracy.
4. **Hybrid Objective Role:** Removing the "Hybrid Objective" leads to a significant underestimation of the ATE (mean ~135) and a moderate increase in error, indicating its importance for correct central tendency estimation.
### Interpretation
This ablation study demonstrates the additive value of each component in the BELM-MDCM model for estimating the Average Treatment Effect on the Challenge Dataset.
* **What the data suggests:** The full model architecture is necessary for optimal performance. Each ablated component leads to a specific type of failure: loss of the Hybrid Objective causes systematic underestimation, loss of Targeted Modeling causes catastrophic overestimation and instability, and loss of Exact Invertibility (DDIM) reduces precision.
* **How elements relate:** The two charts are complementary. The top chart shows *directional bias* (how far the estimate is from the truth), while the bottom chart shows *magnitude of error*. The "w/o Targeted Modeling" variant is particularly interesting: while its mean error (~50) isn't the highest, its enormous standard deviation indicates that in some runs, it can be wildly inaccurate (error up to ~190), making it unreliable.
* **Notable anomaly:** The error bar for `w/o Targeted Modeling` in the bottom chart extends into negative values (to ~-90). Since absolute error cannot be negative, this likely represents the lower bound of the standard deviation calculation around a positive mean, visually emphasizing the extreme variance rather than a literal negative error.
* **Conclusion:** The "Targeted Modeling" component appears to be the most critical for stabilizing the estimation process and preventing large deviations. The "Hybrid Objective" is essential for centering the estimate correctly, and "Exact Invertibility (DDIM)" provides a final layer of refinement. The full model synergistically combines these elements to achieve accurate and precise ATE estimation.