## Line Chart: Accuracy vs. Sample Size (k)
### Overview
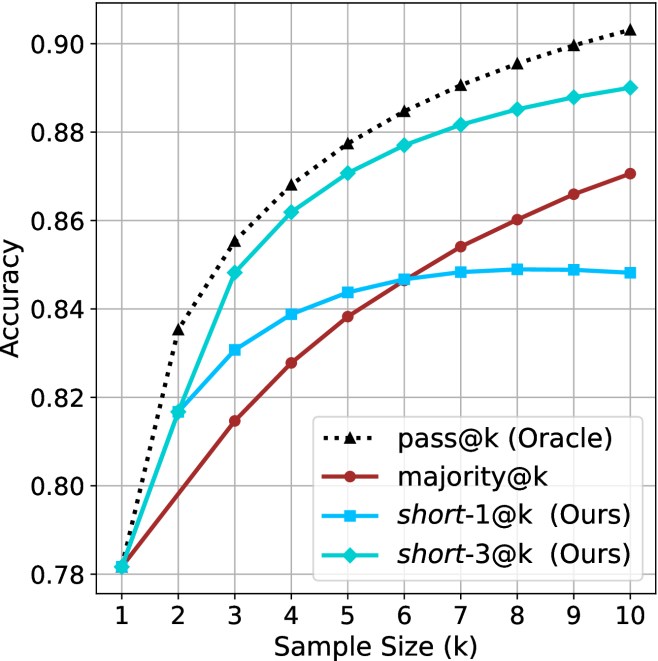
The image is a line chart comparing the performance of four different methods or models as a function of sample size (k). The chart plots "Accuracy" on the y-axis against "Sample Size (k)" on the x-axis. All methods show an increasing trend in accuracy as the sample size grows, but they diverge significantly in their rates of improvement and final performance levels.
### Components/Axes
* **Chart Type:** Line chart with markers.
* **X-Axis:**
* **Label:** "Sample Size (k)"
* **Scale:** Linear, from 1 to 10.
* **Markers/Ticks:** Integers 1, 2, 3, 4, 5, 6, 7, 8, 9, 10.
* **Y-Axis:**
* **Label:** "Accuracy"
* **Scale:** Linear, from 0.78 to 0.90.
* **Markers/Ticks:** 0.78, 0.80, 0.82, 0.84, 0.86, 0.88, 0.90.
* **Legend:** Located in the bottom-right quadrant of the chart area.
* **Series 1:** `pass@k (Oracle)` - Represented by a black, dotted line with upward-pointing triangle markers (▲).
* **Series 2:** `majority@k` - Represented by a solid, dark red (maroon) line with circle markers (●).
* **Series 3:** `short-1@k (Ours)` - Represented by a solid, bright blue line with square markers (■).
* **Series 4:** `short-3@k (Ours)` - Represented by a solid, cyan (light blue-green) line with diamond markers (◆).
### Detailed Analysis
**Trend Verification & Data Point Extraction:**
The following table lists approximate accuracy values for each method at each sample size (k). Values are estimated from the chart's gridlines. The visual trend for each series is described first.
1. **pass@k (Oracle) [Black Dotted Line, ▲]:** Shows the steepest and most consistent upward slope, achieving the highest accuracy at every point after k=1.
* k=1: ~0.78
* k=2: ~0.835
* k=3: ~0.855
* k=4: ~0.868
* k=5: ~0.877
* k=6: ~0.884
* k=7: ~0.890
* k=8: ~0.895
* k=9: ~0.899
* k=10: ~0.902
2. **short-3@k (Ours) [Cyan Line, ◆]:** Shows a strong upward slope, closely following but consistently below the Oracle line. It is the second-best performing method.
* k=1: ~0.78
* k=2: ~0.818
* k=3: ~0.848
* k=4: ~0.862
* k=5: ~0.871
* k=6: ~0.877
* k=7: ~0.881
* k=8: ~0.885
* k=9: ~0.888
* k=10: ~0.890
3. **majority@k [Dark Red Line, ●]:** Shows a steady, moderate upward slope. It starts as the lowest-performing method but surpasses `short-1@k` around k=6.
* k=1: ~0.78
* k=2: ~0.798
* k=3: ~0.815
* k=4: ~0.828
* k=5: ~0.839
* k=6: ~0.846
* k=7: ~0.854
* k=8: ~0.860
* k=9: ~0.866
* k=10: ~0.871
4. **short-1@k (Ours) [Blue Line, ■]:** Shows an initial upward slope that flattens significantly after k=6, exhibiting a plateau effect. It is overtaken by `majority@k` in the latter half.
* k=1: ~0.78
* k=2: ~0.818
* k=3: ~0.831
* k=4: ~0.839
* k=5: ~0.844
* k=6: ~0.847
* k=7: ~0.848
* k=8: ~0.849
* k=9: ~0.849
* k=10: ~0.848
### Key Observations
1. **Performance Hierarchy:** A clear and consistent performance hierarchy is established for k > 1: `pass@k (Oracle)` > `short-3@k (Ours)` > `majority@k` ≈ `short-1@k (Ours)` (with a crossover).
2. **Diminishing Returns:** All methods show diminishing returns (the slope decreases as k increases), but this is most extreme for `short-1@k (Ours)`, which nearly plateaus after k=6.
3. **Crossover Point:** The `majority@k` method, while starting slower, shows more sustained improvement and overtakes `short-1@k (Ours)` between k=5 and k=6.
4. **Convergence at k=1:** All four methods begin at approximately the same accuracy point (~0.78) when the sample size is 1.
5. **Gap Analysis:** The performance gap between the best (`Oracle`) and the proposed `short-3` method remains relatively constant (~0.01-0.015 accuracy points) across most sample sizes. The gap between `short-3` and `short-1` widens substantially as k increases.
### Interpretation
This chart likely comes from a research paper in machine learning or statistics, comparing different strategies for aggregating results from multiple samples or trials (where `k` is the number of samples). The "Oracle" represents an idealized upper-bound performance.
* **What the data suggests:** The proposed method `short-3@k` is highly effective, achieving performance close to the theoretical Oracle and significantly outperforming the baseline `majority@k` rule. However, the variant `short-1@k` suffers from severe saturation, indicating that its strategy does not scale well with increased sample size.
* **Relationship between elements:** The chart demonstrates the trade-off between sample efficiency and final accuracy. While all methods benefit from more samples (`k`), the choice of aggregation strategy (`short-3` vs. `short-1` vs. `majority`) dramatically impacts how effectively that additional data is utilized.
* **Notable anomaly/insight:** The plateau of `short-1@k` is a critical finding. It suggests that this particular method hits a fundamental limit in its ability to leverage additional samples, making it a poor choice for scenarios where `k` can be large. In contrast, `short-3@k` and `majority@k` continue to improve, with `short-3@k` maintaining a superior rate of improvement. This implies the "short-3" strategy is more robust and scalable.