## Line Chart: Accuracy vs. Sample Size (k)
### Overview
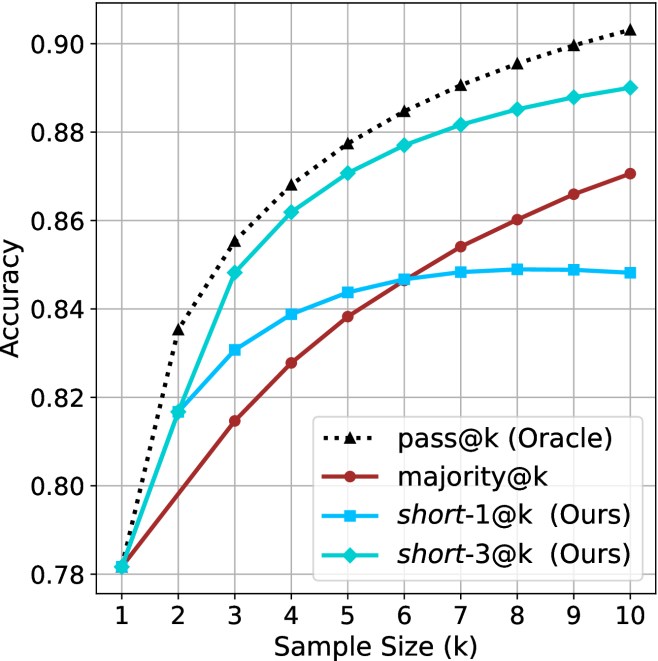
The chart compares the accuracy of four different methods across sample sizes from 1 to 10. The y-axis represents accuracy (0.78–0.90), and the x-axis represents sample size (k). Four data series are plotted: "pass@k (Oracle)" (black dotted line), "majority@k" (red solid line), "short-1@k (Ours)" (blue solid line), and "short-3@k (Ours)" (green solid line). The legend is positioned at the bottom-right corner.
### Components/Axes
- **X-axis**: "Sample Size (k)" with integer markers from 1 to 10.
- **Y-axis**: "Accuracy" with decimal markers from 0.78 to 0.90.
- **Legend**:
- Black dotted line with triangles: "pass@k (Oracle)"
- Red solid line: "majority@k"
- Blue solid line: "short-1@k (Ours)"
- Green solid line: "short-3@k (Ours)"
### Detailed Analysis
1. **pass@k (Oracle)**:
- Starts at 0.78 (k=1) and increases steadily to 0.90 (k=10).
- Values: 0.78 (k=1), 0.82 (k=2), 0.84 (k=3), 0.86 (k=4), 0.87 (k=5), 0.88 (k=6), 0.89 (k=7), 0.90 (k=8–10).
2. **majority@k**:
- Starts at 0.78 (k=1) and rises gradually to 0.87 (k=10).
- Values: 0.78 (k=1), 0.81 (k=2), 0.82 (k=3), 0.83 (k=4), 0.84 (k=5), 0.85 (k=6), 0.86 (k=7), 0.87 (k=8–10).
3. **short-1@k (Ours)**:
- Starts at 0.78 (k=1), peaks at 0.85 (k=5), then plateaus.
- Values: 0.78 (k=1), 0.82 (k=2), 0.84 (k=3), 0.85 (k=4–10).
4. **short-3@k (Ours)**:
- Starts at 0.78 (k=1), peaks at 0.88 (k=5), then plateaus.
- Values: 0.78 (k=1), 0.82 (k=2), 0.86 (k=3), 0.88 (k=4–10).
### Key Observations
- The "pass@k (Oracle)" line shows the highest accuracy across all sample sizes, increasing linearly.
- "short-3@k (Ours)" outperforms "short-1@k (Ours)" consistently, with a peak accuracy of 0.88 at k=5.
- "majority@k" has the lowest accuracy, trailing behind all other methods.
- All methods plateau after k=5, except "pass@k (Oracle)", which continues to rise.
### Interpretation
The chart demonstrates that the "pass@k (Oracle)" method achieves the highest accuracy, suggesting it is the most effective baseline. The "short-3@k (Ours)" method outperforms "short-1@k (Ours)" by 0.03 accuracy at k=5, indicating that increasing the sample size for the "short" methods improves performance. The "majority@k" method’s lower accuracy suggests it is less effective compared to the other approaches. The plateauing trends for "short-1@k" and "short-3@k" after k=5 imply diminishing returns beyond this sample size. The Oracle’s continuous improvement highlights its superiority as a reference standard.