## Line Chart: Accuracy vs. Layer Index for Different Models
### Overview
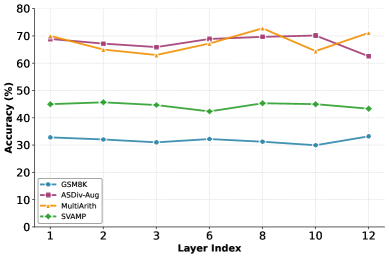
The image is a line chart comparing the accuracy of four different models (GSMBK, ASDiv-Aug, MultiArith, and SVAMP) across different layer indices (1, 2, 3, 6, 8, 10, and 12). The chart displays accuracy on the y-axis and layer index on the x-axis.
### Components/Axes
* **X-axis:** Layer Index, with values 1, 2, 3, 6, 8, 10, and 12.
* **Y-axis:** Accuracy (%), ranging from 0 to 80, with tick marks at intervals of 10.
* **Legend:** Located in the bottom-left corner, mapping colors to model names:
* Blue: GSMBK
* Purple: ASDiv-Aug
* Orange: MultiArith
* Green: SVAMP
### Detailed Analysis
* **GSMBK (Blue):** The accuracy remains relatively stable across all layer indices, fluctuating between approximately 31% and 33%.
* Layer 1: ~33%
* Layer 2: ~32%
* Layer 3: ~31%
* Layer 6: ~32%
* Layer 8: ~31%
* Layer 10: ~30%
* Layer 12: ~33%
* **ASDiv-Aug (Purple):** The accuracy is generally high, starting at approximately 69%, decreasing slightly to around 66% at layer 3, peaking at layer 8 (~71%), and then decreasing to ~62% at layer 12.
* Layer 1: ~69%
* Layer 2: ~68%
* Layer 3: ~66%
* Layer 6: ~68%
* Layer 8: ~71%
* Layer 10: ~70%
* Layer 12: ~62%
* **MultiArith (Orange):** The accuracy starts high at approximately 69%, decreases to around 63% at layer 3, increases to around 70% at layer 8, and then decreases to ~65% at layer 10, before increasing again to ~71% at layer 12.
* Layer 1: ~69%
* Layer 2: ~65%
* Layer 3: ~63%
* Layer 6: ~69%
* Layer 8: ~70%
* Layer 10: ~65%
* Layer 12: ~71%
* **SVAMP (Green):** The accuracy is relatively stable, fluctuating between approximately 42% and 46%.
* Layer 1: ~45%
* Layer 2: ~46%
* Layer 3: ~45%
* Layer 6: ~42%
* Layer 8: ~46%
* Layer 10: ~43%
* Layer 12: ~44%
### Key Observations
* ASDiv-Aug and MultiArith models generally outperform GSMBK and SVAMP in terms of accuracy.
* GSMBK shows the lowest accuracy among the four models.
* SVAMP shows a relatively stable accuracy across all layers.
* ASDiv-Aug and MultiArith show some fluctuation in accuracy across different layers, but generally maintain high performance.
### Interpretation
The chart illustrates the performance of different models across various layers. The ASDiv-Aug and MultiArith models demonstrate superior accuracy compared to GSMBK and SVAMP. The relatively stable performance of GSMBK and SVAMP suggests that their accuracy is less affected by the depth of the layers. The fluctuations in accuracy for ASDiv-Aug and MultiArith may indicate that certain layers are more critical for these models' performance. The data suggests that ASDiv-Aug and MultiArith are better suited for the task being evaluated, as they consistently achieve higher accuracy.