\n
## Line Chart: Accuracy vs. Layer Index
### Overview
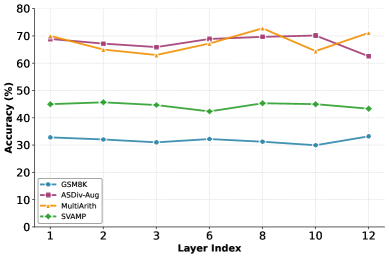
The image presents a line chart illustrating the accuracy of four different models (GSMBK, ASDiv-Aug, MultiArith, and SVAMP) across 12 layers. The y-axis represents accuracy in percentage, while the x-axis represents the layer index.
### Components/Axes
* **X-axis:** Layer Index (ranging from 1 to 12).
* **Y-axis:** Accuracy (%) (ranging from 0 to 80).
* **Legend:** Located in the bottom-left corner, identifying the four data series:
* GSMBK (represented by a light blue dashed line)
* ASDiv-Aug (represented by a purple dashed line)
* MultiArith (represented by an orange solid line)
* SVAMP (represented by a green solid line)
* **Gridlines:** Present to aid in reading values.
### Detailed Analysis
Here's a breakdown of each data series, with approximate values:
* **GSMBK (Light Blue Dashed Line):** The line is relatively flat, fluctuating around 32-35%.
* Layer 1: ~70%
* Layer 2: ~68%
* Layer 3: ~65%
* Layer 6: ~68%
* Layer 8: ~72%
* Layer 10: ~70%
* Layer 12: ~66%
* **ASDiv-Aug (Purple Dashed Line):** This line shows a slight downward trend overall.
* Layer 1: ~68%
* Layer 2: ~67%
* Layer 3: ~65%
* Layer 6: ~68%
* Layer 8: ~70%
* Layer 10: ~68%
* Layer 12: ~65%
* **MultiArith (Orange Solid Line):** This line exhibits a more pronounced fluctuation, peaking around layer 8.
* Layer 1: ~68%
* Layer 2: ~65%
* Layer 3: ~64%
* Layer 6: ~68%
* Layer 8: ~74%
* Layer 10: ~70%
* Layer 12: ~66%
* **SVAMP (Green Solid Line):** This line remains relatively stable, hovering around 45-50%.
* Layer 1: ~47%
* Layer 2: ~47%
* Layer 3: ~45%
* Layer 6: ~48%
* Layer 8: ~49%
* Layer 10: ~47%
* Layer 12: ~47%
### Key Observations
* The MultiArith model consistently demonstrates the highest accuracy, peaking at approximately 74% at layer 8.
* GSMBK and ASDiv-Aug exhibit similar accuracy levels, fluctuating between 65% and 72%.
* SVAMP maintains a relatively stable accuracy around 47-49%.
* There is no clear, consistent trend across all models; accuracy fluctuates with layer index.
### Interpretation
The chart suggests that the performance of these models varies depending on the layer index. MultiArith appears to be the most effective model overall, particularly at layer 8. The relatively stable performance of SVAMP indicates its robustness across different layers. The fluctuations observed in all models suggest that the accuracy is sensitive to the specific layer being evaluated. The differences in accuracy between the models could be attributed to variations in their architectures, training data, or optimization strategies. The data does not provide information on *why* these differences exist, only that they *do* exist. Further investigation would be needed to understand the underlying factors driving these performance variations.