## Network Diagram: Strong Connections between Equations
### Overview
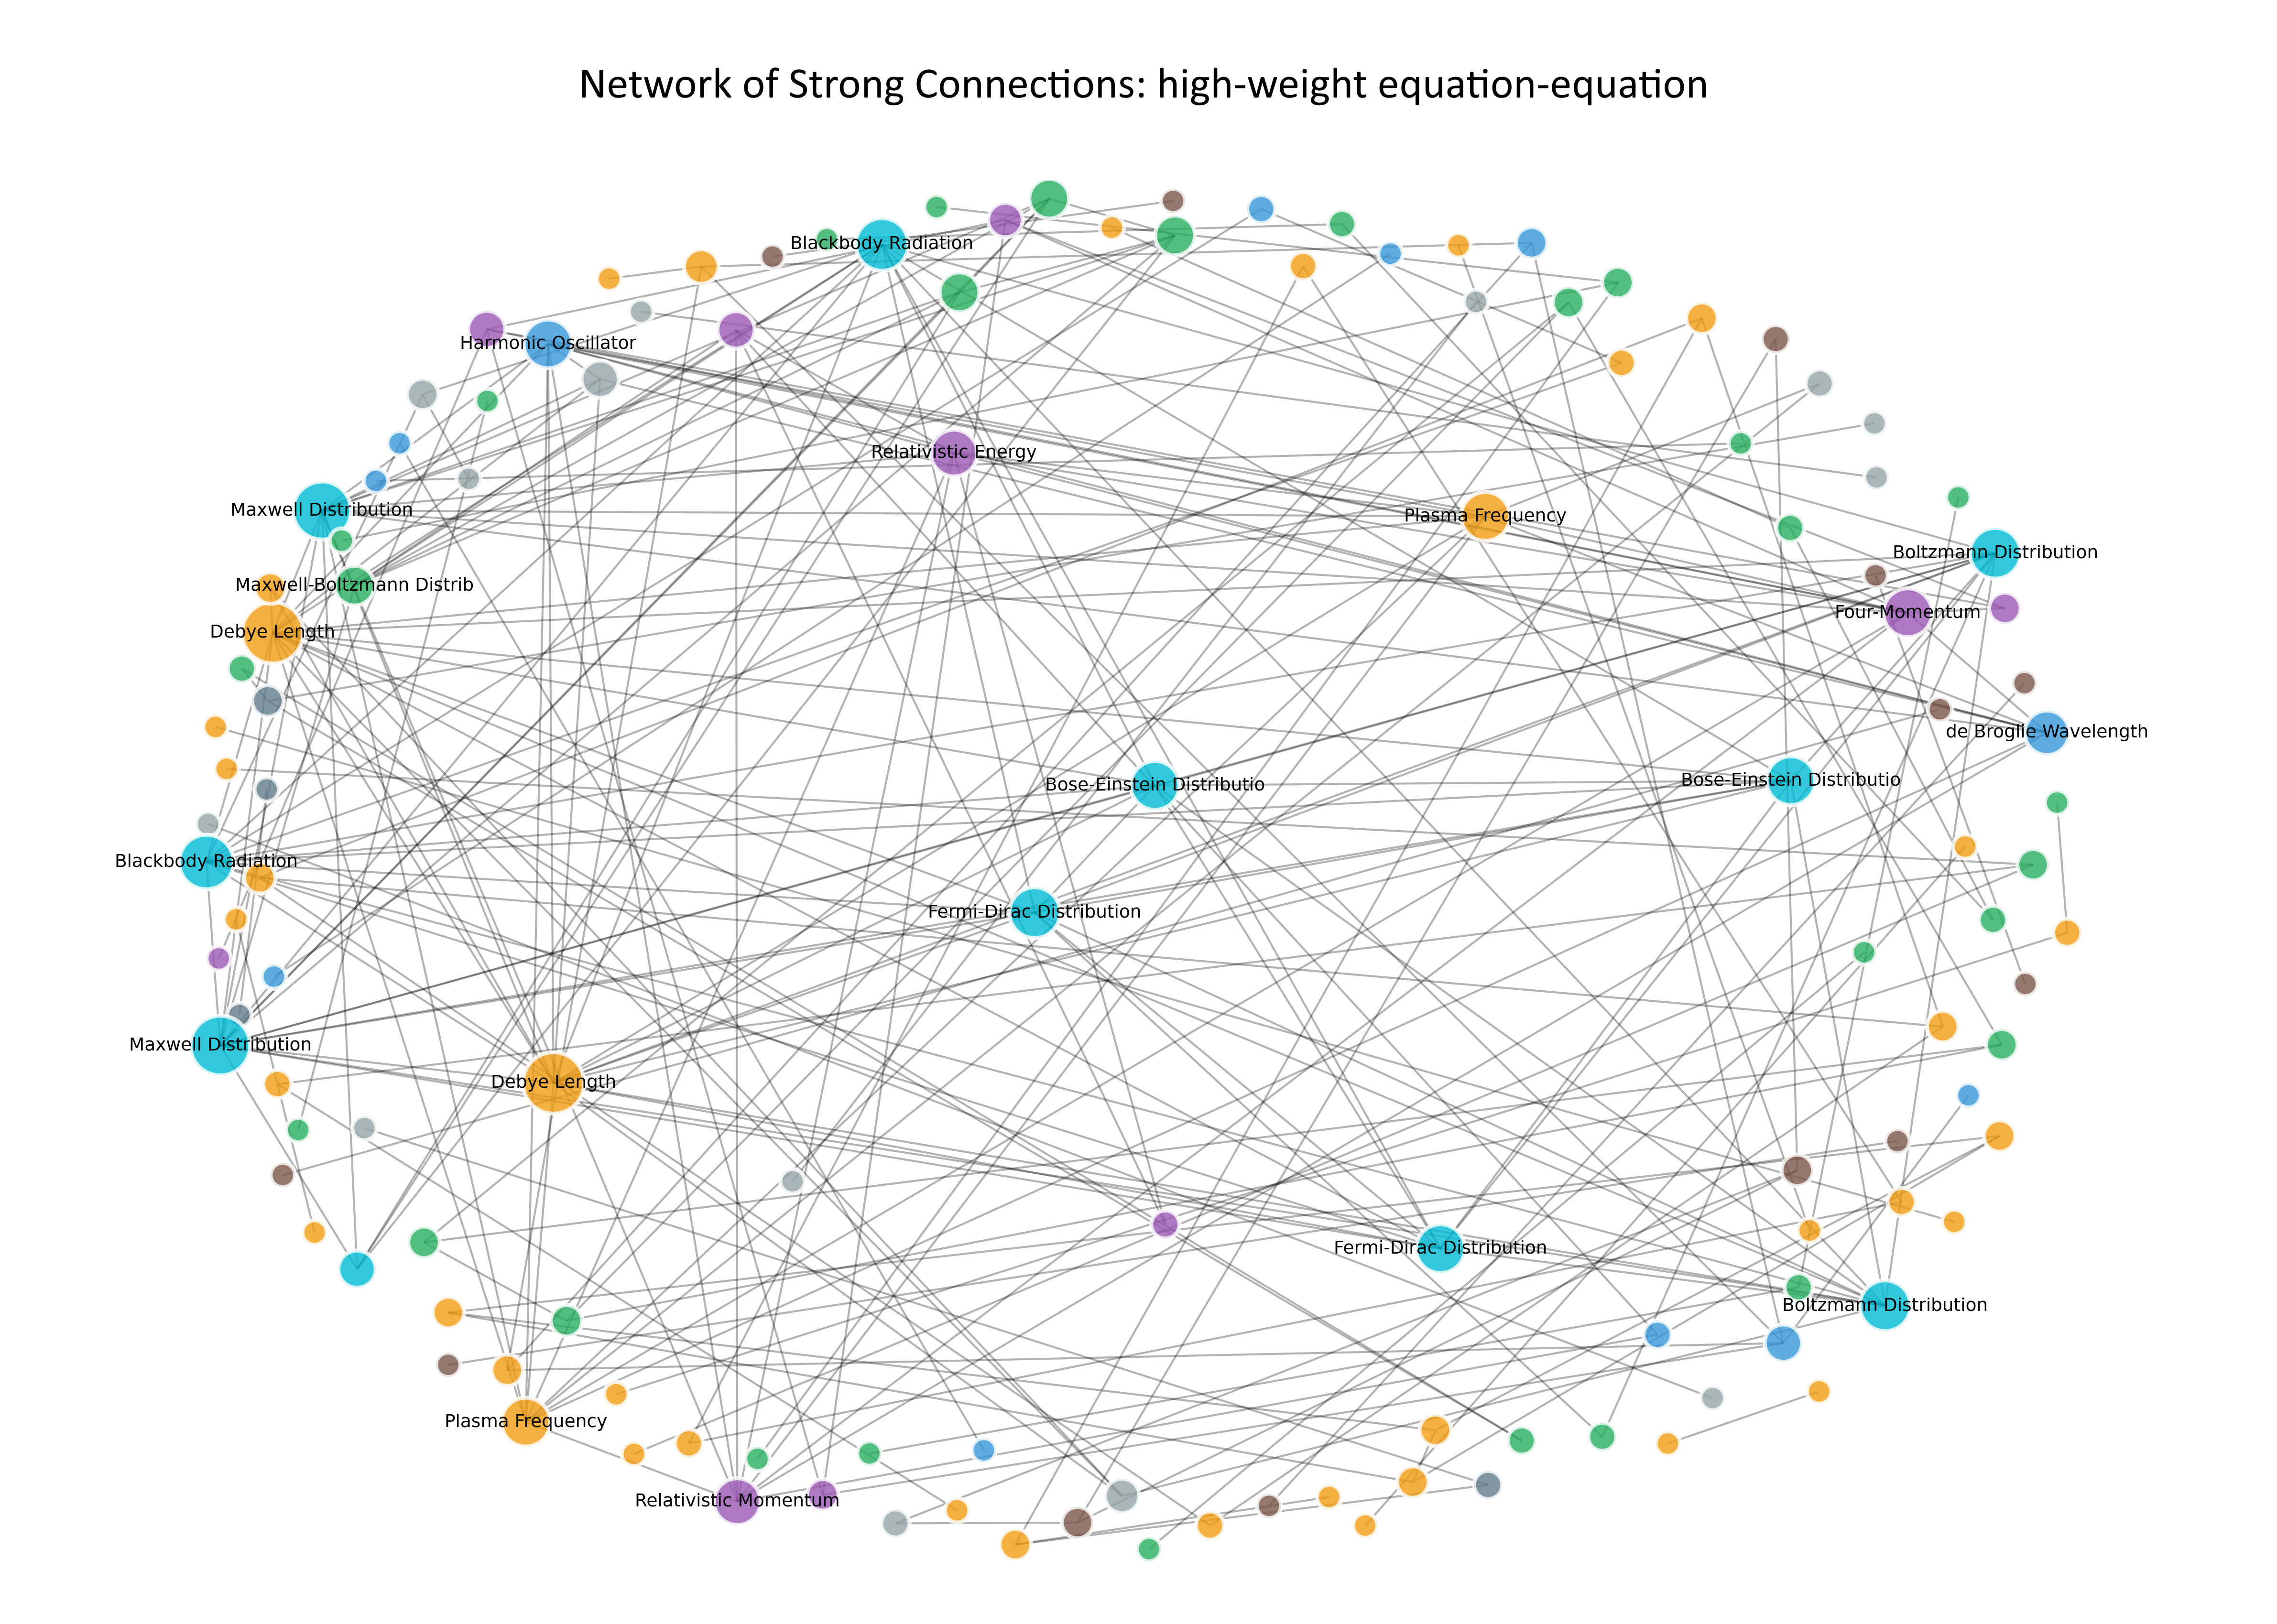
The image is a network diagram illustrating strong connections between various physics-related equations or concepts. Nodes represent these equations/concepts, and edges (lines) indicate a strong relationship or connection between them. The nodes are colored differently, but there is no explicit legend to define what the colors represent. The size of the nodes may indicate the relative importance or degree of connectivity.
### Components/Axes
* **Title:** "Network of Strong Connections: high-weight equation-equation"
* **Nodes:** Represented by colored circles, each labeled with a specific equation or concept.
* Examples: Blackbody Radiation, Relativistic Energy, Plasma Frequency, Boltzmann Distribution, de Broglie Wavelength, Bose-Einstein Distribution, Fermi-Dirac Distribution, Debye Length, Maxwell Distribution, Harmonic Oscillator, Four-Momentum, Maxwell-Boltzmann Distrib, Relativistic Momentum
* **Edges:** Represented by gray lines connecting the nodes, indicating a strong connection.
* **Node Colors:** The nodes are colored in a variety of colors including: orange, green, light blue, purple, gray, and brown. There is no legend to indicate what the colors represent.
* **Node Size:** The nodes are of varying sizes.
### Detailed Analysis or Content Details
Here's a breakdown of the nodes and their approximate positions, along with observations about their connections:
* **Blackbody Radiation:** Located in the top-left quadrant, connected to multiple nodes. Node color is light blue.
* **Relativistic Energy:** Located near the top-center, connected to multiple nodes. Node color is green.
* **Plasma Frequency:** Located in the top-right quadrant, connected to multiple nodes. Node color is orange.
* **Boltzmann Distribution:** Located in the right quadrant, connected to multiple nodes. Node color is light blue.
* **de Broglie Wavelength:** Located in the right quadrant, connected to multiple nodes. Node color is light blue.
* **Bose-Einstein Distribution:** Located near the center, connected to multiple nodes. Node color is light blue.
* **Fermi-Dirac Distribution:** Located near the center-bottom, connected to multiple nodes. Node color is light blue.
* **Debye Length:** Located in the left quadrant, connected to multiple nodes. Node color is orange.
* **Maxwell Distribution:** Located in the left quadrant, connected to multiple nodes. Node color is light blue.
* **Harmonic Oscillator:** Located in the top-left quadrant, connected to multiple nodes. Node color is gray.
* **Four-Momentum:** Located in the right quadrant, connected to multiple nodes. Node color is purple.
* **Maxwell-Boltzmann Distrib:** Located in the left quadrant, connected to multiple nodes. Node color is gray.
* **Relativistic Momentum:** Located in the bottom-center, connected to multiple nodes. Node color is purple.
**Observations on Connections:**
* The network appears densely connected, with most nodes having multiple connections to other nodes.
* There doesn't appear to be a clear hierarchical structure; the connections seem relatively distributed.
* The node sizes vary, suggesting some equations/concepts have a higher degree of connectivity or importance within the network.
### Key Observations
* The diagram illustrates relationships between various physics concepts.
* The connections are "high-weight," suggesting strong relationships.
* Node size appears to correlate with the number of connections.
* Node color is not explained.
### Interpretation
The network diagram visualizes the interconnectedness of various equations and concepts in physics. The "high-weight" connections suggest that the relationships depicted are significant and fundamental. The varying node sizes likely indicate the relative importance or influence of each equation/concept within the network. Without a legend for the node colors, it's difficult to determine if the colors represent specific categories or properties. The diagram suggests that these equations/concepts are not isolated but rather form a complex web of relationships, highlighting the underlying unity of physics. The diagram could be used to understand the relationships between different concepts in physics, or to identify key areas for further research.