## Network Diagram: Network of Strong Connections: high-weight equation-equation
### Overview
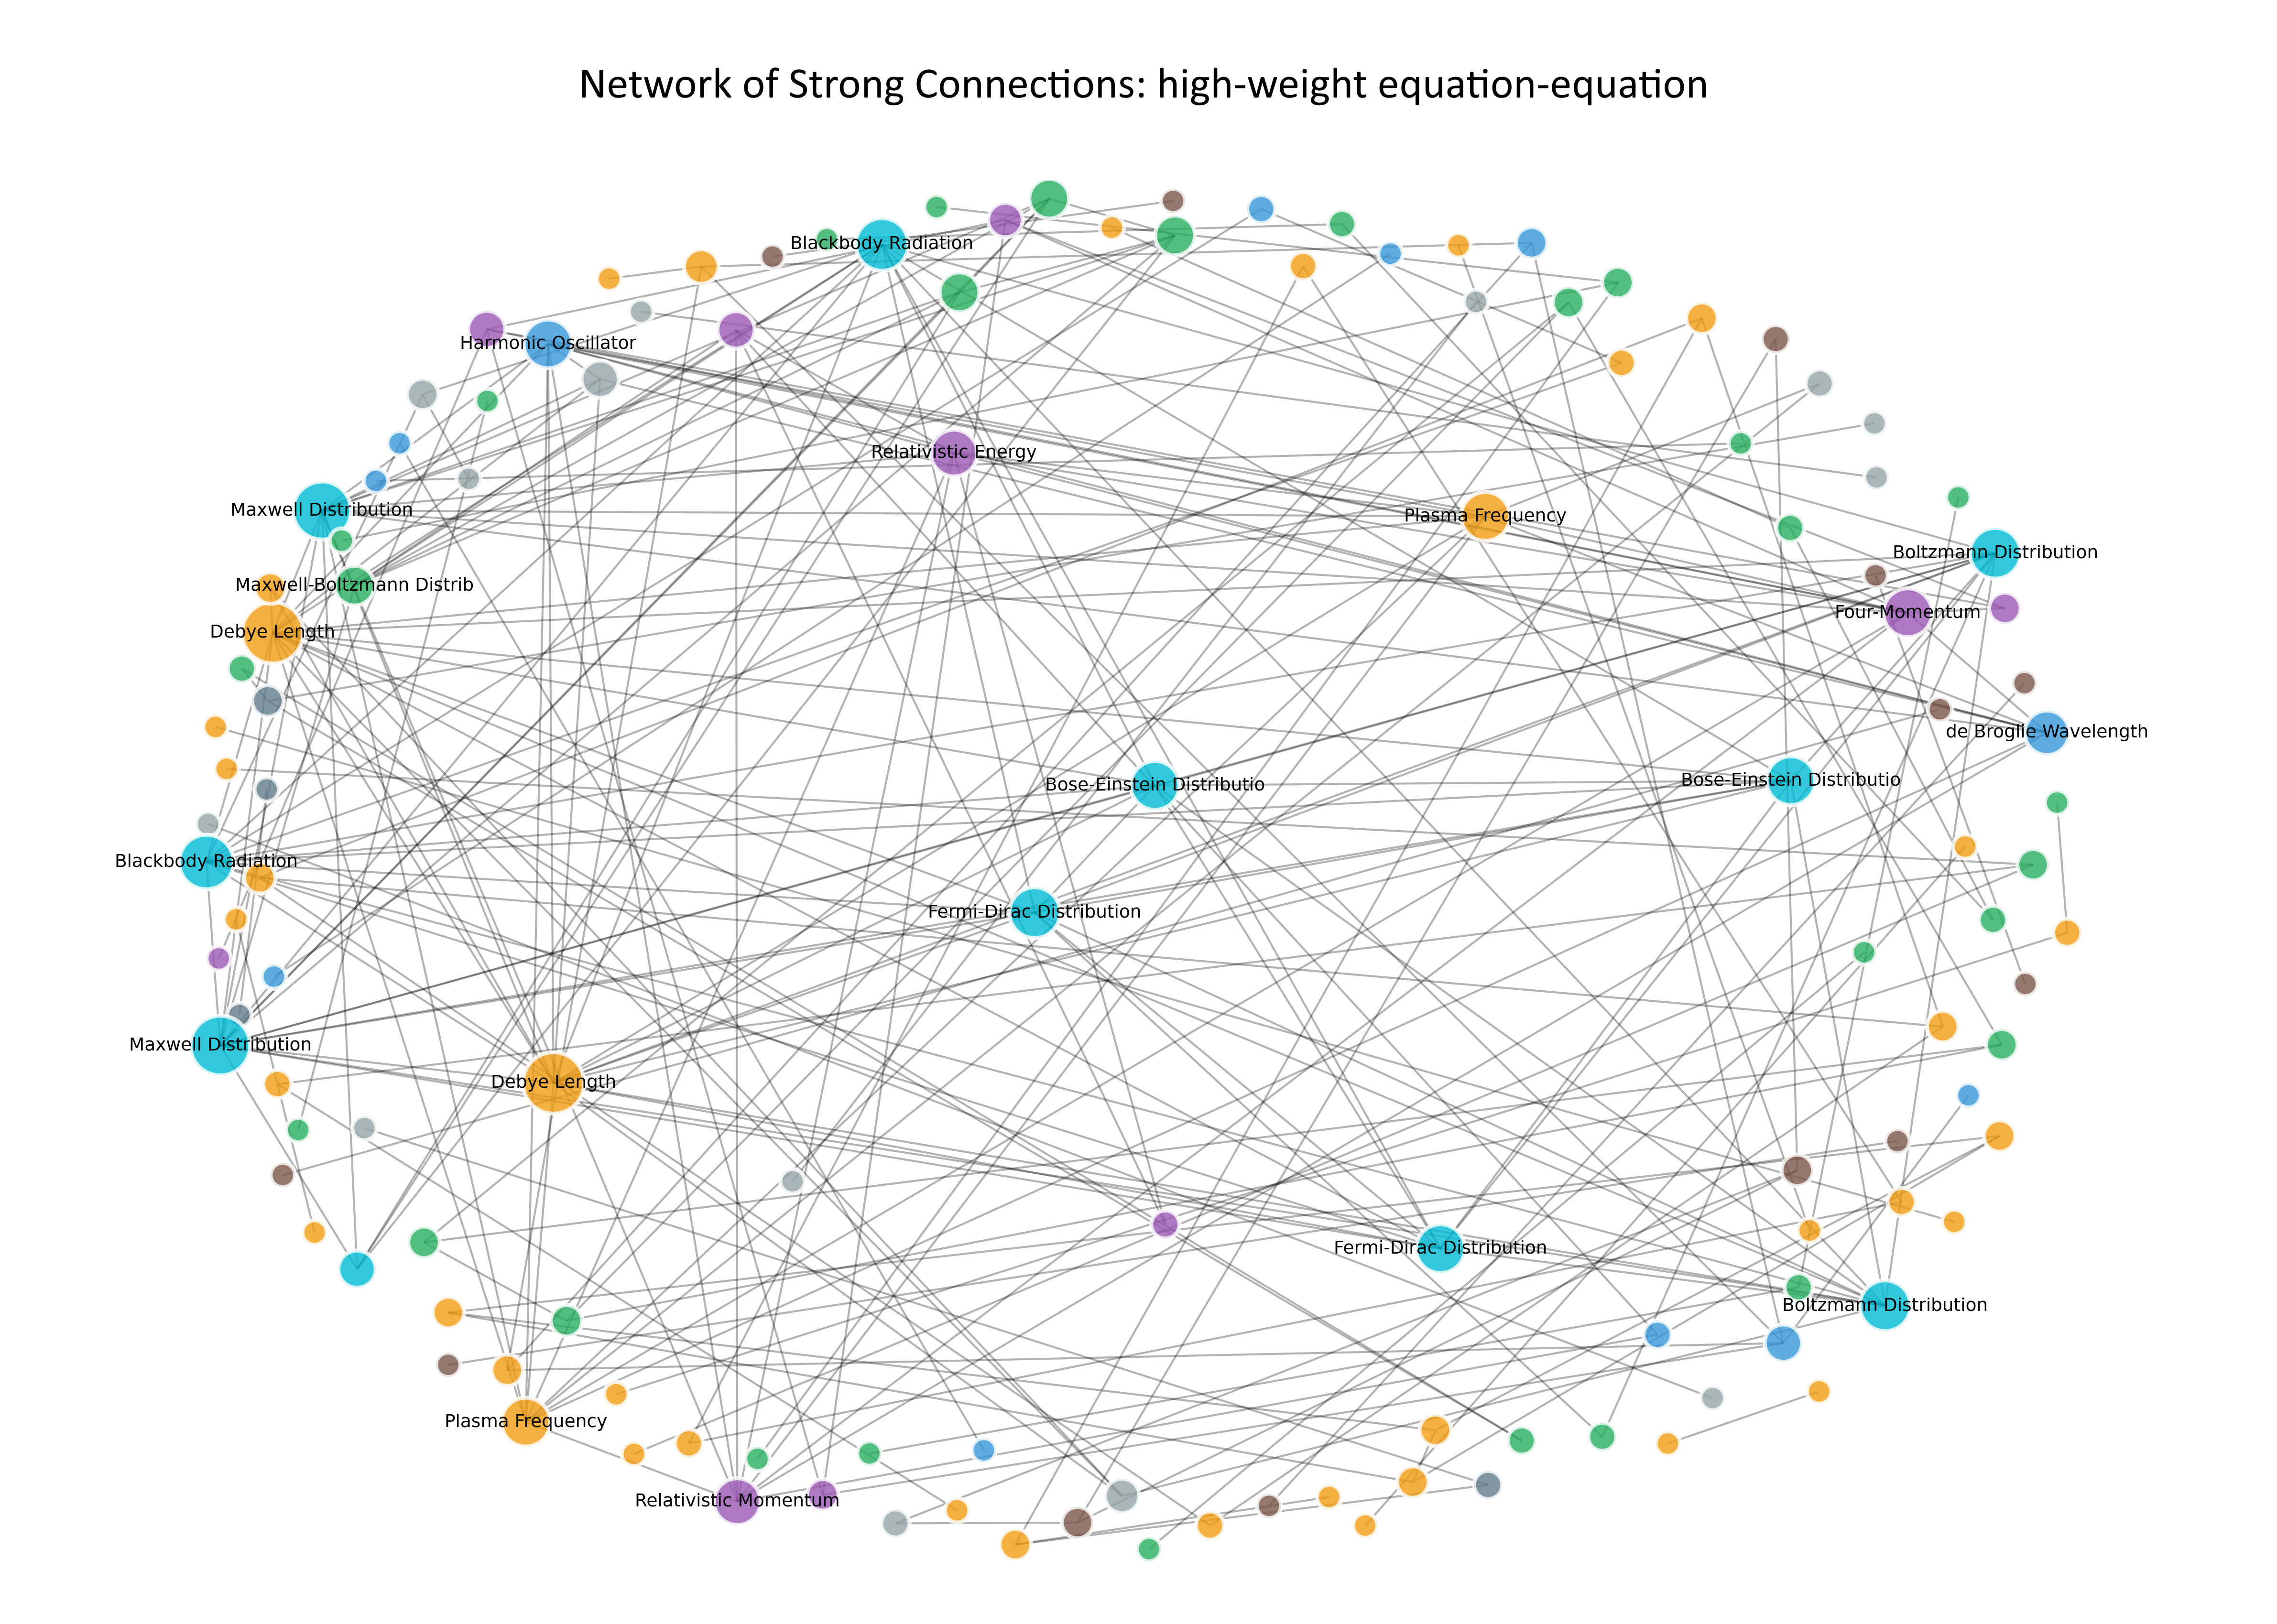
The image presents a network diagram illustrating connections between various physical concepts and equations. Nodes represent these concepts, and edges (lines) indicate the strength of the relationship between them. The diagram appears to be undirected, meaning the connection is bidirectional. The title "Network of Strong Connections: high-weight equation-equation" suggests the connections represent significant mathematical relationships.
### Components/Axes
The diagram consists of nodes labeled with terms related to physics, particularly statistical mechanics, electromagnetism, and relativity. There are no explicit axes in the traditional sense, but the spatial arrangement of nodes and lines defines the network structure. A color-coded legend is present in the top-right corner, associating colors with different categories of concepts.
**Legend:**
* **Green:** Plasma Frequency
* **Blue:** Fermi-Dirac Distribution
* **Orange:** Boltzmann Distribution
* **Purple:** Blackbody Radiation
* **Yellow:** Relativistic Energy/Momentum
* **Light Blue:** Maxwell Distribution
* **Red:** Debye Length
* **Dark Green:** Bose-Einstein Distribution
* **Pink:** de Broglie Wavelength
**Nodes (Concepts):**
* Blackbody Radiation (appears twice)
* Harmonic Oscillator
* Maxwell Distribution (appears twice)
* Maxwell-Boltzmann Distribution (appears twice)
* Debye Length (appears twice)
* Plasma Frequency (appears twice)
* Boltzmann Distribution (appears twice)
* Four-Momentum
* de Broglie Wavelength
* Relativistic Energy
* Relativistic Momentum (appears twice)
* Fermi-Dirac Distribution (appears twice)
* Bose-Einstein Distribution (appears twice)
### Detailed Analysis
The diagram is complex, with numerous connections. The density of connections varies across the network.
* **Blackbody Radiation (Purple):** Located in the top-center, it has connections to Harmonic Oscillator, Maxwell Distribution, Relativistic Energy, and Plasma Frequency.
* **Harmonic Oscillator (Yellow):** Connected to Blackbody Radiation and Maxwell Distribution.
* **Maxwell Distribution (Light Blue):** Connected to Harmonic Oscillator, Blackbody Radiation, Maxwell-Boltzmann Distribution, and Debye Length.
* **Maxwell-Boltzmann Distribution (Light Blue):** Connected to Maxwell Distribution and Debye Length.
* **Debye Length (Red):** Connected to Maxwell Distribution, Maxwell-Boltzmann Distribution, Plasma Frequency, and Blackbody Radiation.
* **Plasma Frequency (Green):** Connected to Debye Length, Blackbody Radiation, Boltzmann Distribution, and Relativistic Momentum.
* **Boltzmann Distribution (Orange):** Connected to Plasma Frequency, Four-Momentum, and Fermi-Dirac Distribution.
* **Four-Momentum (Orange):** Connected to Boltzmann Distribution and de Broglie Wavelength.
* **de Broglie Wavelength (Pink):** Connected to Four-Momentum and Bose-Einstein Distribution.
* **Relativistic Energy (Yellow):** Connected to Blackbody Radiation and Relativistic Momentum.
* **Relativistic Momentum (Yellow):** Connected to Relativistic Energy, Plasma Frequency, and Fermi-Dirac Distribution.
* **Fermi-Dirac Distribution (Blue):** Connected to Boltzmann Distribution, Relativistic Momentum, and Bose-Einstein Distribution.
* **Bose-Einstein Distribution (Dark Green):** Connected to Fermi-Dirac Distribution and de Broglie Wavelength.
The connections are represented by gray lines. The thickness of the lines is not visually distinguishable, suggesting all connections have equal weight. The network appears to be roughly symmetrical, with a concentration of connections in the central region.
### Key Observations
* **Highly Connected Nodes:** Blackbody Radiation, Plasma Frequency, and Fermi-Dirac Distribution appear to be the most highly connected nodes, suggesting they are central to the network.
* **Cluster Formation:** There's a noticeable cluster of nodes in the top-center (Blackbody Radiation, Harmonic Oscillator, Maxwell Distribution, Relativistic Energy, Plasma Frequency) and a similar cluster in the bottom-center (Fermi-Dirac Distribution, Relativistic Momentum, Boltzmann Distribution, Bose-Einstein Distribution).
* **Color Distribution:** The colors are relatively evenly distributed throughout the network, indicating that concepts from all categories are interconnected.
### Interpretation
This network diagram visually represents the interconnectedness of various physical concepts. The "high-weight equation-equation" title suggests that these connections are based on significant mathematical relationships between the concepts. The diagram demonstrates that concepts from different areas of physics (statistical mechanics, electromagnetism, relativity) are not isolated but are deeply intertwined.
The central role of Blackbody Radiation, Plasma Frequency, and Fermi-Dirac Distribution suggests these concepts are fundamental and serve as bridges between other areas. The clustering of nodes indicates that certain concepts are more closely related to each other than others.
The diagram is a qualitative representation of the strength of these connections. While all lines appear to have equal weight visually, the diagram could be used to inform a quantitative analysis of the relationships between these concepts, potentially revealing underlying mathematical structures or dependencies. The diagram is a useful tool for visualizing the complexity of physical systems and identifying key relationships between different concepts.