## Network Diagram: Network of Strong Connections: high-weight equation-equation
### Overview
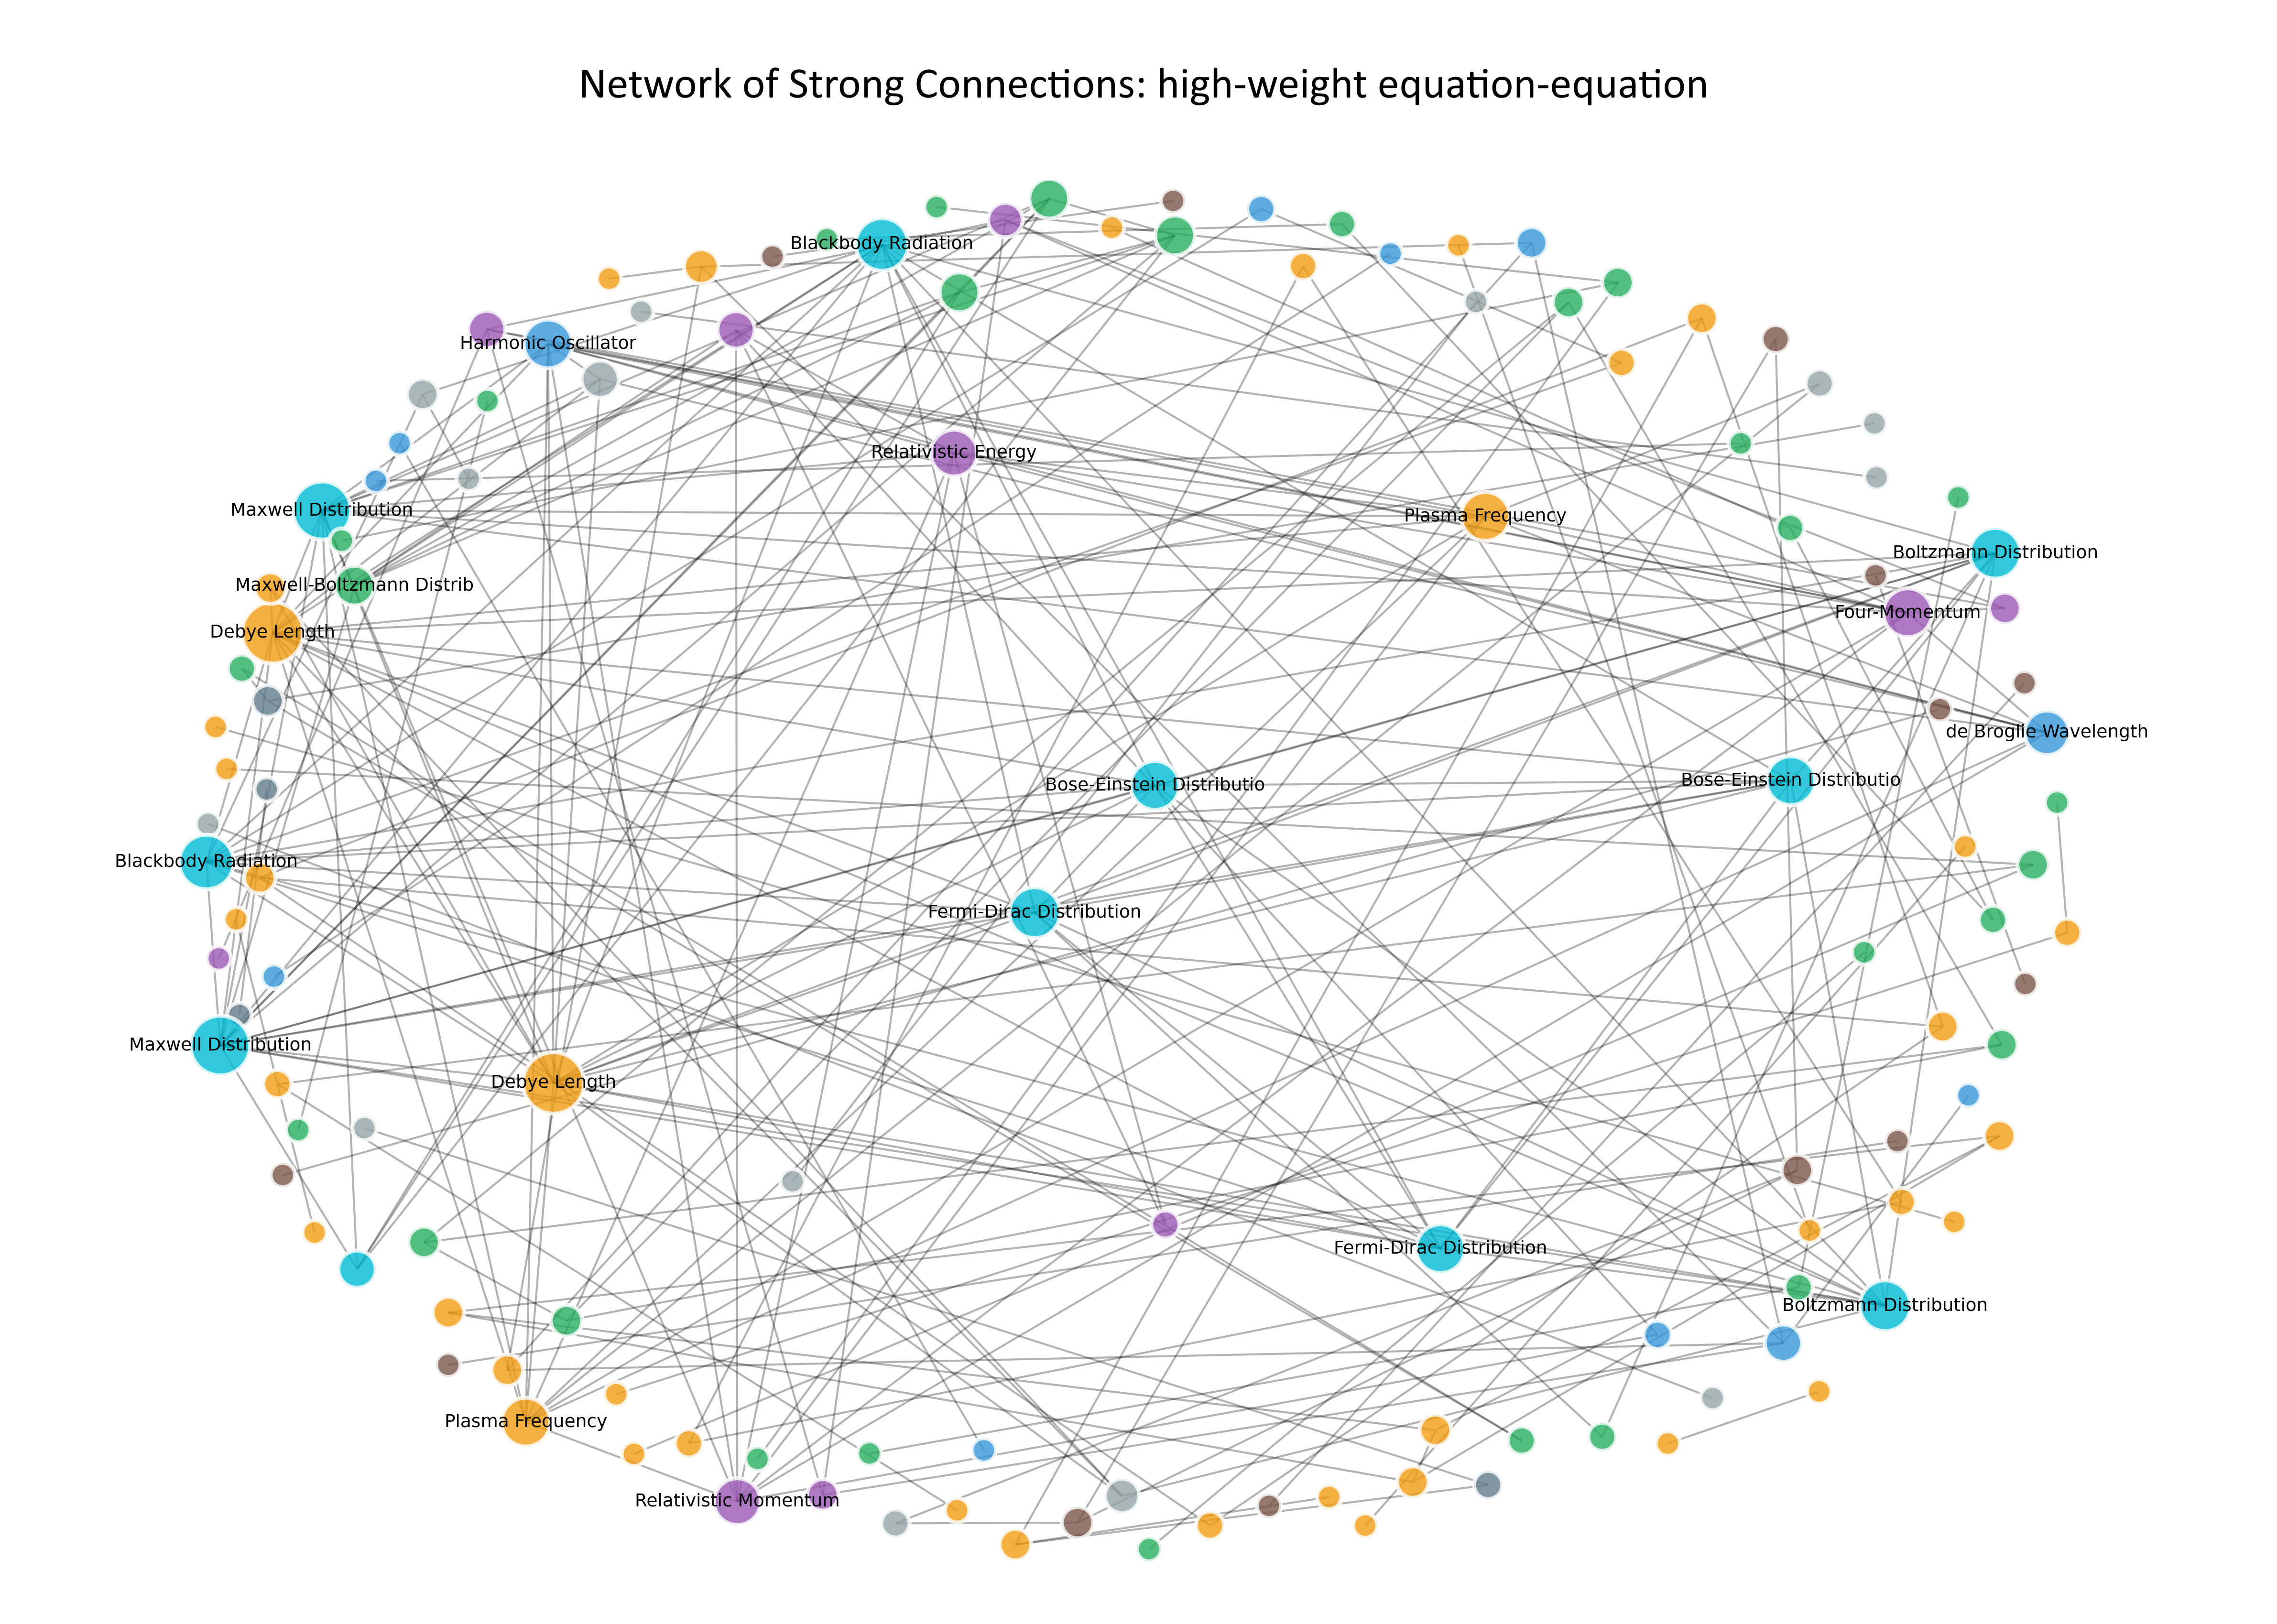
This is a circular network graph visualizing high-weight (strong) connections between core physics equations and concepts. Nodes represent individual concepts/equations, colored and sized by their role/importance, with gray edges indicating strong relational links between them. The graph is arranged in a circular layout, with nodes placed around the perimeter and some central nodes, creating a dense web of interconnections.
### Components/Elements
1. **Title**: Centered at the top: *Network of Strong Connections: high-weight equation-equation*
2. **Nodes**: Categorized by color and size:
- **Large Cyan Nodes (Hub Concepts)**: Blackbody Radiation (top-center left), Maxwell Distribution (left upper, left lower), Boltzmann Distribution (right upper, right lower), Bose-Einstein Distribution (center, right center), Fermi-Dirac Distribution (center lower, right lower)
- **Medium Orange Nodes**: Debye Length (left upper, center lower), Plasma Frequency (right upper, left lower)
- **Medium Purple Nodes**: Harmonic Oscillator (top left), Relativistic Energy (top center), Four-Momentum (right upper), Relativistic Momentum (bottom center)
- **Small Nodes (scattered around perimeter)**: Green, brown, gray, blue nodes (unlabeled, representing secondary/related concepts)
3. **Edges**: Gray lines connecting nodes, representing high-weight (strong) relationships between the concepts. Edge density is highest between the large cyan hub nodes.
### Detailed Analysis
- **Labeled Node List (with position and color)**:
1. Blackbody Radiation (top-center left, cyan, large)
2. Harmonic Oscillator (top left, purple, medium)
3. Maxwell Distribution (left upper, cyan, large)
4. Maxwell-Boltzmann Distrib (left upper, green, small; truncated label for Maxwell-Boltzmann Distribution)
5. Debye Length (left upper, orange, medium)
6. Blackbody Radiation (left middle, cyan, large)
7. Maxwell Distribution (left lower, cyan, large)
8. Debye Length (center lower, orange, medium)
9. Plasma Frequency (left lower, orange, medium)
10. Relativistic Momentum (bottom center, purple, medium)
11. Plasma Frequency (right upper, orange, medium)
12. Relativistic Energy (top center, purple, medium)
13. Bose-Einstein Distributio (center, cyan, large; truncated label for Bose-Einstein Distribution)
14. Fermi-Dirac Distribution (center lower, cyan, large)
15. Fermi-Dirac Distribution (right lower, cyan, large)
16. Boltzmann Distribution (right lower, cyan, large)
17. Bose-Einstein Distributio (right center, cyan, large; truncated label for Bose-Einstein Distribution)
18. Boltzmann Distribution (right upper, cyan, large)
19. Four-Momentum (right upper, purple, medium)
20. de Broglie Wavelength (right upper, blue, small)
- **Edge Density**: The highest concentration of edges connects the large cyan hub nodes, indicating these concepts are the most interconnected in the network.
### Key Observations
1. **Hub Nodes**: The large cyan nodes (Blackbody Radiation, Maxwell/Boltzmann/Bose-Einstein/Fermi-Dirac Distributions) are the most connected, acting as central hubs for the network.
2. **Cross-Domain Connections**: Purple nodes (relativistic/quantum concepts like Relativistic Energy, Harmonic Oscillator) connect to multiple cyan hubs, showing links between classical statistical mechanics and relativistic/quantum physics.
3. **Secondary Hubs**: Orange nodes (Debye Length, Plasma Frequency) are well-connected, bridging multiple hub nodes.
4. **Truncated Labels**: Some node labels are truncated (e.g., *Maxwell-Boltzmann Distrib*, *Bose-Einstein Distributio*), indicating longer full names.
### Interpretation
This diagram illustrates the highly interconnected nature of core physics concepts, particularly in statistical mechanics, thermodynamics, and quantum/relativistic physics. The central cyan nodes represent foundational equations that underpin multiple areas of physics, as evidenced by their dense connections to other concepts. The presence of relativistic and quantum nodes linked to classical statistical concepts shows the cross-theoretical relationships in physics, highlighting how these domains build on and relate to one another. This network can help identify which equations are most critical for understanding the relationships between different physical theories, and how concepts from different subfields interact.