## Line Charts: Relative Reconstruction Error vs. Calibration Tokens
### Overview
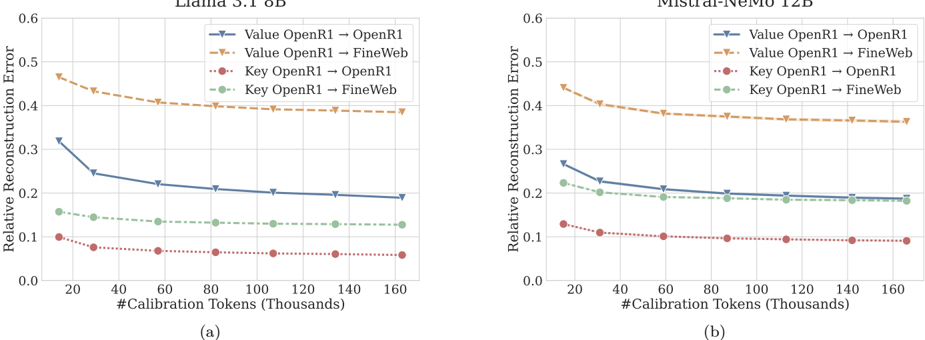
This image displays two side-by-side line charts, labeled (a) and (b), comparing the "Relative Reconstruction Error" of two Large Language Models (LLMs) across varying numbers of calibration tokens.
* **Chart (a)** represents the **Llama 3.1 8B** model.
* **Chart (b)** represents the **Mistral-NeMo 12B** model.
Both charts evaluate four distinct configurations involving "Value" and "Key" parameters, calibrated against either "OpenR1" or "FineWeb" datasets.
### Components/Axes
The axes and legend are identical for both charts:
* **Y-Axis:** Labeled "Relative Reconstruction Error," ranging from 0.0 to 0.6.
* **X-Axis:** Labeled "#Calibration Tokens (Thousands)," ranging from 20 to 160 (with tick marks every 20 units).
* **Legend (Positioned at the top-right of each chart):**
* **Blue solid line with inverted triangle markers:** "Value OpenR1 -> OpenR1"
* **Orange dashed line with inverted triangle markers:** "Value OpenR1 -> FineWeb"
* **Red dotted line with circle markers:** "Key OpenR1 -> OpenR1"
* **Green dashed-dotted line with circle markers:** "Key OpenR1 -> FineWeb"
### Detailed Analysis
#### Chart (a): Llama 3.1 8B
All four series show a downward trend, indicating that increasing the number of calibration tokens reduces the reconstruction error. The curves flatten significantly after approximately 80,000 tokens.
* **Value OpenR1 -> FineWeb (Orange):** Starts at ~0.47 (at 20k tokens) and decreases to ~0.39 (at 160k tokens). This is the highest error series.
* **Value OpenR1 -> OpenR1 (Blue):** Starts at ~0.32 and decreases to ~0.19.
* **Key OpenR1 -> FineWeb (Green):** Starts at ~0.16 and decreases to ~0.13.
* **Key OpenR1 -> OpenR1 (Red):** Starts at ~0.10 and decreases to ~0.06. This is the lowest error series.
#### Chart (b): Mistral-NeMo 12B
Similar to Chart (a), all series show a downward trend with diminishing returns after 80,000 tokens.
* **Value OpenR1 -> FineWeb (Orange):** Starts at ~0.45 and decreases to ~0.37. This is the highest error series.
* **Value OpenR1 -> OpenR1 (Blue):** Starts at ~0.27 and decreases to ~0.19.
* **Key OpenR1 -> FineWeb (Green):** Starts at ~0.23 and decreases to ~0.19.
* **Key OpenR1 -> OpenR1 (Red):** Starts at ~0.13 and decreases to ~0.09. This is the lowest error series.
### Key Observations
* **Consistent Hierarchy:** In both models, the "Value" parameters consistently exhibit higher reconstruction errors than the "Key" parameters.
* **Dataset Sensitivity:** For the "Value" parameters, reconstructing against the "FineWeb" dataset results in higher error than reconstructing against "OpenR1."
* **Diminishing Returns:** The most significant reduction in error occurs between 20k and 60k tokens. Beyond 100k tokens, the curves are nearly horizontal, suggesting that additional calibration tokens provide negligible improvements in reconstruction accuracy.
* **Model Comparison:** The error magnitudes are generally comparable between the two models, though the "Key" parameter errors are slightly higher in the Mistral-NeMo 12B model compared to the Llama 3.1 8B model.
### Interpretation
This data likely pertains to the quantization or compression of the Key-Value (KV) cache in LLMs. The "Relative Reconstruction Error" measures how well the compressed/quantized parameters approximate the original, uncompressed parameters.
The data demonstrates that:
1. **Parameter Sensitivity:** The model's "Value" parameters are more sensitive to compression/quantization than the "Key" parameters, as evidenced by the significantly higher error rates for all "Value" lines.
2. **Distribution Alignment:** The models are better at reconstructing their own training distribution (OpenR1) than a general-purpose web corpus (FineWeb), suggesting that calibration is more effective when the calibration data distribution matches the model's primary training data.
3. **Efficiency Threshold:** There is a clear "sweet spot" for calibration data size. Using more than ~80k-100k tokens yields very little gain, implying that computational resources for calibration can be optimized by capping the token count at this threshold.