## Sankey Diagram: Clue Topics vs. Inference Topics
### Overview
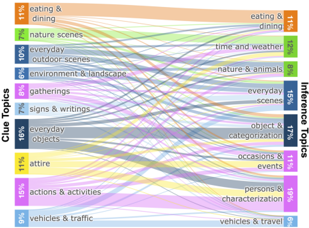
This Sankey diagram illustrates the relationship between "Clue Topics" and "Inference Topics," showing the flow and distribution of associations between them. The diagram displays the percentage of each topic and the strength of the connections between clue topics and inference topics.
### Components/Axes
* **Left Side:** "Clue Topics" - Lists various topics that serve as clues.
* **Right Side:** "Inference Topics" - Lists topics that are inferred from the clues.
* **Nodes:** Each topic is represented by a node, with its percentage value displayed next to it.
* **Links:** The connections between the nodes represent the flow from clue topics to inference topics, with the width of the link indicating the strength of the association.
* **Percentages:** Each topic has a percentage value indicating its relative importance or frequency.
### Detailed Analysis
**Clue Topics (Left Side):**
* **Eating & Dining:** 11% (Orange)
* **Nature Scenes:** 7% (Green)
* **Everyday Outdoor Scenes:** 10% (Yellow)
* **Environment & Landscape:** 6% (Dark Green)
* **Gatherings:** 8% (Gray)
* **Signs & Writings:** 7% (Light Brown)
* **Everyday Objects:** 16% (Dark Brown)
* **Attire:** 11% (Light Yellow)
* **Actions & Activities:** 15% (Pink)
* **Vehicles & Traffic:** 9% (Light Blue)
**Inference Topics (Right Side):**
* **Eating & Dining:** 11% (Orange)
* **Time and Weather:** 12% (Light Green)
* **Nature & Animals:** 8% (Dark Green)
* **Everyday Scenes:** 15% (Yellow)
* **Object & Categorization:** 17% (Dark Brown)
* **Occasions & Events:** 11% (Light Yellow)
* **Persons & Characterization:** 19% (Pink)
* **Vehicles & Travel:** 9% (Light Blue)
**Connections and Flow:**
* **Eating & Dining (11%):** Clue topic connects strongly to the same inference topic.
* **Nature Scenes (7%):** Clue topic connects to Nature & Animals.
* **Everyday Outdoor Scenes (10%):** Clue topic connects to Everyday Scenes.
* **Environment & Landscape (6%):** Clue topic connects to Nature & Animals.
* **Gatherings (8%):** Clue topic connects to Occasions & Events.
* **Signs & Writings (7%):** Clue topic connects to Object & Categorization.
* **Everyday Objects (16%):** Clue topic connects strongly to Object & Categorization.
* **Attire (11%):** Clue topic connects to Persons & Characterization.
* **Actions & Activities (15%):** Clue topic connects strongly to Persons & Characterization.
* **Vehicles & Traffic (9%):** Clue topic connects to Vehicles & Travel.
### Key Observations
* **Object & Categorization:** The "Everyday Objects" clue topic (16%) has a strong connection to the "Object & Categorization" inference topic (17%).
* **Persons & Characterization:** The "Actions & Activities" clue topic (15%) has a strong connection to the "Persons & Characterization" inference topic (19%).
* **Direct Correlation:** Some topics, like "Eating & Dining" and "Vehicles & Traffic/Travel," show a direct correlation between the clue and inference topics.
* **Nature Related:** "Nature Scenes" and "Environment & Landscape" both connect to "Nature & Animals".
### Interpretation
The Sankey diagram illustrates how different clue topics lead to specific inferences. The strength of the connections indicates the likelihood of inferring a particular topic from a given clue. For example, "Everyday Objects" strongly suggests "Object & Categorization," while "Actions & Activities" strongly suggests "Persons & Characterization." The diagram highlights the relationships between observable clues and the inferences people draw from them, providing insights into cognitive associations and common-sense reasoning. The direct correlations suggest straightforward associations, while the more complex flows indicate nuanced relationships between clues and inferences.