## Chord Diagram: Clue Topics vs. Inference Topics
### Overview
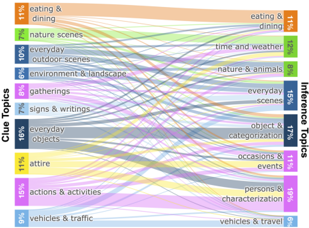
The image is a chord diagram visualizing the relationships between "Clue Topics" and "Inference Topics". The thickness of the chords represents the strength of the association between the two topics. The diagram displays the distribution of connections from each clue topic to various inference topics. Percentages are associated with each topic, indicating their prevalence.
### Components/Axes
* **Left Axis (Clue Topics):** Lists the following categories with associated percentages:
* Eating & Dining (11%)
* Nature Scenes (7%)
* Everyday Outdoor Scenes (10%)
* Environment & Landscape (6%)
* Gatherings (8%)
* Signs & Writings (7%)
* Everyday Objects (16%)
* Attire (11%)
* Actions & Activities (10%)
* Vehicles & Traffic (9%)
* **Right Axis (Inference Topics):** Lists the following categories with associated percentages:
* Eating & Dining (11%)
* Time and Weather (12%)
* Nature & Animals (14%)
* Everyday Scenes (15%)
* Object & Categorization (17%)
* Occasions & Events (11%)
* Persons & Characterization (15%)
* Vehicles & Travel (15%)
### Detailed Analysis
The diagram consists of curved lines (chords) connecting each Clue Topic on the left to one or more Inference Topics on the right. The thickness of each chord indicates the strength of the relationship.
* **Eating & Dining (11%):** Shows strong connections to itself (Eating & Dining - 11%), and moderate connections to Occasions & Events (approximately 6%), and Time and Weather (approximately 3%).
* **Nature Scenes (7%):** Primarily connects to Nature & Animals (approximately 6%), and a weaker connection to Time and Weather (approximately 1%).
* **Everyday Outdoor Scenes (10%):** Connects strongly to Everyday Scenes (approximately 8%), and moderately to Nature & Animals (approximately 2%).
* **Environment & Landscape (6%):** Shows a moderate connection to Nature & Animals (approximately 4%) and a weaker connection to Everyday Scenes (approximately 1%).
* **Gatherings (8%):** Connects to Occasions & Events (approximately 6%) and Persons & Characterization (approximately 2%).
* **Signs & Writings (7%):** Primarily connects to Object & Categorization (approximately 5%) and Everyday Scenes (approximately 2%).
* **Everyday Objects (16%):** Shows the strongest connection to Object & Categorization (approximately 12%), and moderate connections to Everyday Scenes (approximately 3%) and Persons & Characterization (approximately 1%).
* **Attire (11%):** Connects to Persons & Characterization (approximately 8%) and Occasions & Events (approximately 3%).
* **Actions & Activities (10%):** Connects to Persons & Characterization (approximately 7%) and Everyday Scenes (approximately 3%).
* **Vehicles & Traffic (9%):** Connects to Vehicles & Travel (approximately 7%) and Everyday Scenes (approximately 2%).
### Key Observations
* **Self-Loops:** Several Clue Topics have strong connections to themselves (e.g., Eating & Dining to Eating & Dining).
* **Object & Categorization:** Everyday Objects has the strongest overall connection to Object & Categorization.
* **Persons & Characterization:** Attire, Actions & Activities, and Gatherings all show significant connections to Persons & Characterization.
* **Everyday Scenes:** Several Clue Topics (Everyday Outdoor Scenes, Environment & Landscape, Signs & Writings, Everyday Objects, Actions & Activities, Vehicles & Traffic) connect to Everyday Scenes.
* **Uneven Distribution:** The Clue Topics are not evenly distributed in terms of their connections. Everyday Objects has the most connections, while Nature Scenes has the fewest.
### Interpretation
This chord diagram illustrates how different "Clue Topics" are interpreted or lead to different "Inference Topics". The diagram suggests that certain clues are more directly related to specific inferences. For example, observing "Eating & Dining" strongly suggests an inference related to "Eating & Dining" itself, indicating a direct and obvious connection. The strong link between "Everyday Objects" and "Object & Categorization" suggests that identifying everyday objects often leads to categorization tasks.
The connections to "Persons & Characterization" from clues like "Attire" and "Actions & Activities" highlight the role of these clues in inferring information about people. The prevalence of connections to "Everyday Scenes" suggests that many clues contribute to understanding general everyday situations.
The varying thickness of the chords indicates the strength of these associations. Thicker chords represent more frequent or reliable inferences based on the given clues. The diagram provides a visual representation of the relationships between observed clues and the inferences that can be drawn from them, potentially useful in fields like image understanding, scene interpretation, or cognitive modeling.