# Technical Document Extraction: Line Graph Analysis
## 1. Axis Labels and Markers
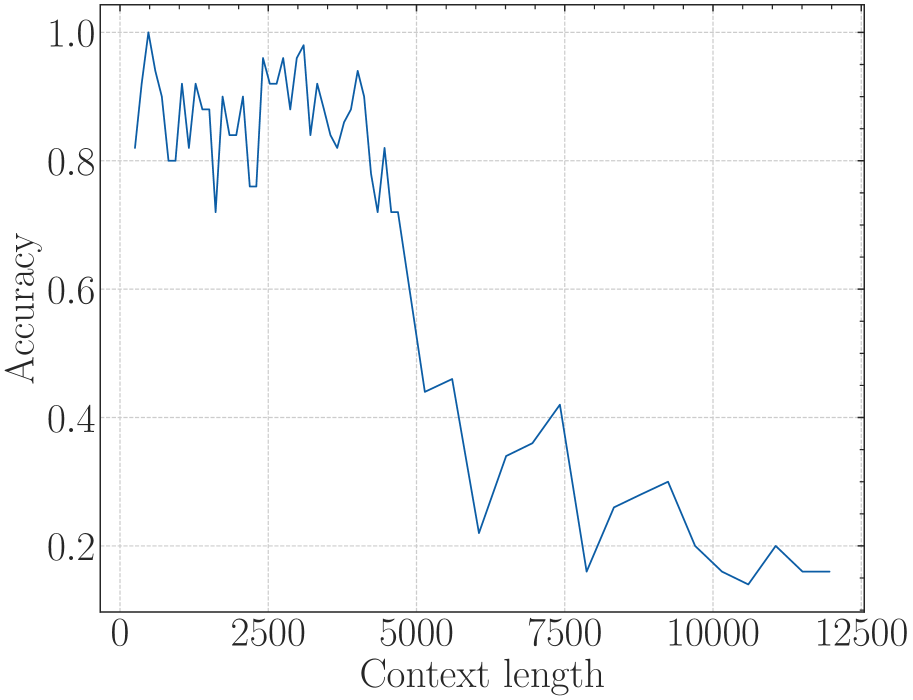
- **X-Axis (Horizontal):**
- Label: "Context length"
- Range: 0 to 12500
- Markers: 0, 2500, 5000, 7500, 10000, 12500
- **Y-Axis (Vertical):**
- Label: "Accuracy"
- Range: 0.2 to 1.0
- Markers: 0.2, 0.4, 0.6, 0.8, 1.0
## 2. Line Graph Characteristics
- **Line Color:** Blue
- **Trend:**
- Initial high accuracy (~0.8) at x=0.
- Fluctuations observed between x=0 and x=5000, with peaks near 0.9 and troughs near 0.7.
- Steady decline after x=5000, dropping below 0.2 by x=12500.
- No consistent upward or downward trend; erratic behavior dominates early stages.
## 3. Background and Grid
- **Grid:** Dotted lines forming a Cartesian coordinate system.
- **No additional annotations, legends, or secondary data series present.**
## 4. Observations
- **Critical Thresholds:**
- Accuracy drops below 0.4 after x=7500.
- Final accuracy stabilizes near 0.15–0.2 by x=12500.
- **Potential Implications:**
- Performance degradation correlates with increasing context length.
- Early fluctuations suggest sensitivity to input variations at lower context lengths.
## 5. Missing Elements
- **No title or subtitle present.**
- **No legend (despite single data series).**
- **No secondary axes or annotations.**
## 6. Spatial Grounding
- **Legend Position:** Not applicable (no legend present).
- **Line Placement:** Single blue line occupies the entire plot area.
## 7. Trend Verification
- **Visual Confirmation:**
- Line A (blue) starts high, fluctuates, then declines sharply.
- No secondary trends or patterns observed.
## 8. Component Isolation
- **Regions Analyzed:**
- Header: None.
- Main Chart: Line graph with axes and grid.
- Footer: None.
## 9. Data Table Reconstruction
- **Not applicable** (no embedded data table).
## 10. Language and Transcription
- **Language:** English (no non-English text detected).
- **Transcribed Text:**
- Axis labels: "Context length", "Accuracy".
- Axis markers: Numerical values as listed.
## 11. Final Notes
- The graph illustrates a clear inverse relationship between context length and accuracy after x=5000.
- Early-stage fluctuations may indicate model instability or data noise at lower context lengths.