\n
## Pie Chart: Hardware Unit Distribution
### Overview
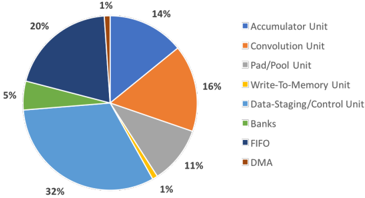
This image presents a pie chart illustrating the distribution of hardware units within a system. The chart is divided into nine segments, each representing a different unit type and its corresponding percentage of the total. A legend is positioned to the right of the chart, providing color-coded labels for each unit.
### Components/Axes
The chart lacks traditional axes, as it's a pie chart representing proportions of a whole. The key components are:
* **Pie Segments:** Representing different hardware units.
* **Percentages:** Displayed next to each segment, indicating the proportion of the whole.
* **Legend:** Located on the right side, mapping colors to unit names.
The legend contains the following labels:
* Accumulator Unit (Blue)
* Convolution Unit (Orange)
* Pad/Pool Unit (Gray)
* Write-To-Memory Unit (Yellow)
* Data-Staging/Control Unit (Dark Blue)
* Banks (Green)
* FIFO (Light Blue)
* DMA (Red)
### Detailed Analysis
The pie chart segments and their approximate percentages are as follows:
* **Accumulator Unit:** 32% (Dark Blue) - Largest segment.
* **Convolution Unit:** 16% (Orange) - Second largest segment.
* **Pad/Pool Unit:** 11% (Gray)
* **Data-Staging/Control Unit:** 20% (Dark Blue)
* **Banks:** 5% (Green)
* **FIFO:** 1% (Light Blue)
* **DMA:** 1% (Red)
* **Write-To-Memory Unit:** 14% (Yellow)
The percentages sum to 100%.
### Key Observations
* The Accumulator Unit constitutes the largest portion (32%) of the hardware units.
* The Convolution Unit is the second most significant component, accounting for 16%.
* FIFO and DMA each represent a very small fraction (1%) of the total.
* The Data-Staging/Control Unit and Pad/Pool Unit are significant components, representing 20% and 11% respectively.
### Interpretation
The data suggests a system heavily reliant on Accumulator Units and Convolution Units. This could indicate a system designed for intensive computation, potentially related to machine learning or signal processing, where accumulation and convolution operations are fundamental. The relatively small percentages of FIFO and DMA suggest that data transfer and buffering are not the primary bottlenecks in this system. The presence of Pad/Pool Units suggests image processing or similar operations where downsampling or feature extraction are important. The distribution highlights the architectural priorities of the system, emphasizing processing capabilities over data handling. The two dark blue segments, Accumulator Unit and Data-Staging/Control Unit, may indicate a tightly coupled control and processing architecture.