\n
## Histograms: Rating Distributions for Language Models
### Overview
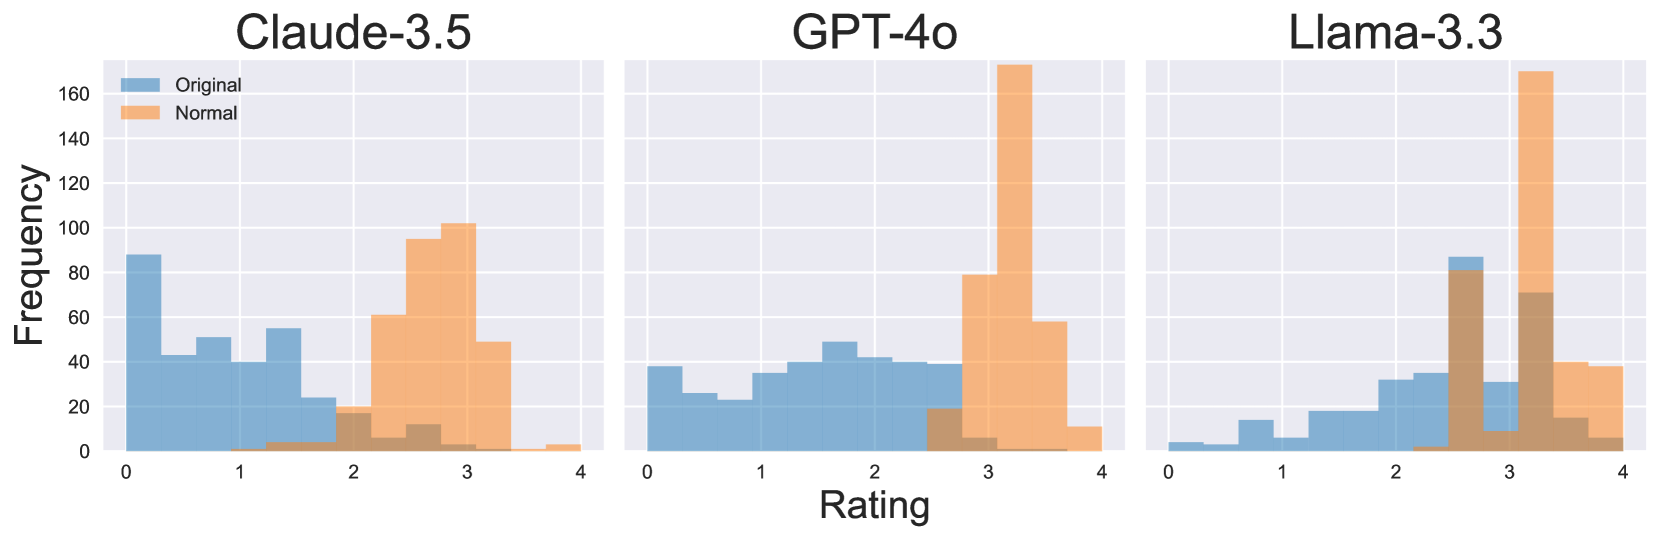
The image presents three histograms, each displaying the distribution of ratings for three different language models: Claude-3.5, GPT-4.0, and Llama-3.3. The x-axis represents the rating scale, and the y-axis represents the frequency (count) of each rating. Each histogram shows two distributions: "Original" (in blue) and "Normal" (in orange).
### Components/Axes
* **X-axis Title:** "Rating" - Scale ranges from 0 to 4.
* **Y-axis Title:** "Frequency" - Scale ranges from 0 to 160.
* **Legend:** Located in the top-left corner.
* "Original" - Represented by a blue color.
* "Normal" - Represented by an orange color.
* **Histograms:** Three separate histograms, one for each language model, positioned horizontally.
* **Claude-3.5:** Leftmost histogram.
* **GPT-4.0:** Center histogram.
* **Llama-3.3:** Rightmost histogram.
### Detailed Analysis
**Claude-3.5:**
* The "Original" distribution slopes upward from a rating of 0 to approximately 2, then declines. The peak frequency is around a rating of 1, at approximately 25.
* The "Normal" distribution is skewed to the right, with a peak frequency around a rating of 3, at approximately 80.
* The "Original" distribution has a maximum frequency of approximately 25 at a rating of 1.
* The "Normal" distribution has a maximum frequency of approximately 80 at a rating of 3.
**GPT-4.0:**
* The "Original" distribution is relatively flat between ratings of 1 and 3, with a slight peak around a rating of 2, at approximately 20.
* The "Normal" distribution is heavily skewed to the right, with a very high peak around a rating of 3, at approximately 160.
* The "Original" distribution has a maximum frequency of approximately 20 at a rating of 2.
* The "Normal" distribution has a maximum frequency of approximately 160 at a rating of 3.
**Llama-3.3:**
* The "Original" distribution is relatively flat between ratings of 1 and 2, with a slight peak around a rating of 1, at approximately 20.
* The "Normal" distribution is strongly skewed to the right, with a peak around a rating of 3, at approximately 100.
* The "Original" distribution has a maximum frequency of approximately 20 at a rating of 1.
* The "Normal" distribution has a maximum frequency of approximately 100 at a rating of 3.
### Key Observations
* All three models show a significant shift in the distribution of ratings when comparing "Original" to "Normal". The "Normal" distribution is consistently skewed to the right, indicating a tendency for higher ratings.
* GPT-4.0 exhibits the most pronounced shift, with a very strong peak at a rating of 3 in the "Normal" distribution.
* Claude-3.5 has the lowest overall frequencies in both distributions.
* The "Original" distributions are generally more evenly distributed across the rating scale compared to the "Normal" distributions.
### Interpretation
The data suggests that the "Normal" process (whatever that may be) consistently improves the ratings assigned to the outputs of these language models. The substantial rightward skew in the "Normal" distributions indicates that the process leads to a higher proportion of outputs receiving higher ratings. The dramatic difference observed in GPT-4.0 suggests that this model benefits the most from the "Normal" process. The "Original" distributions provide a baseline understanding of the raw rating distributions before the "Normal" process is applied. The differences between the models' "Original" distributions may reflect inherent differences in their performance or the types of tasks they are evaluated on. The "Normal" process appears to be a form of post-processing or refinement that significantly enhances the perceived quality of the generated text, particularly for GPT-4.0.