## Histogram: Comparative Rating Distributions for AI Models
### Overview
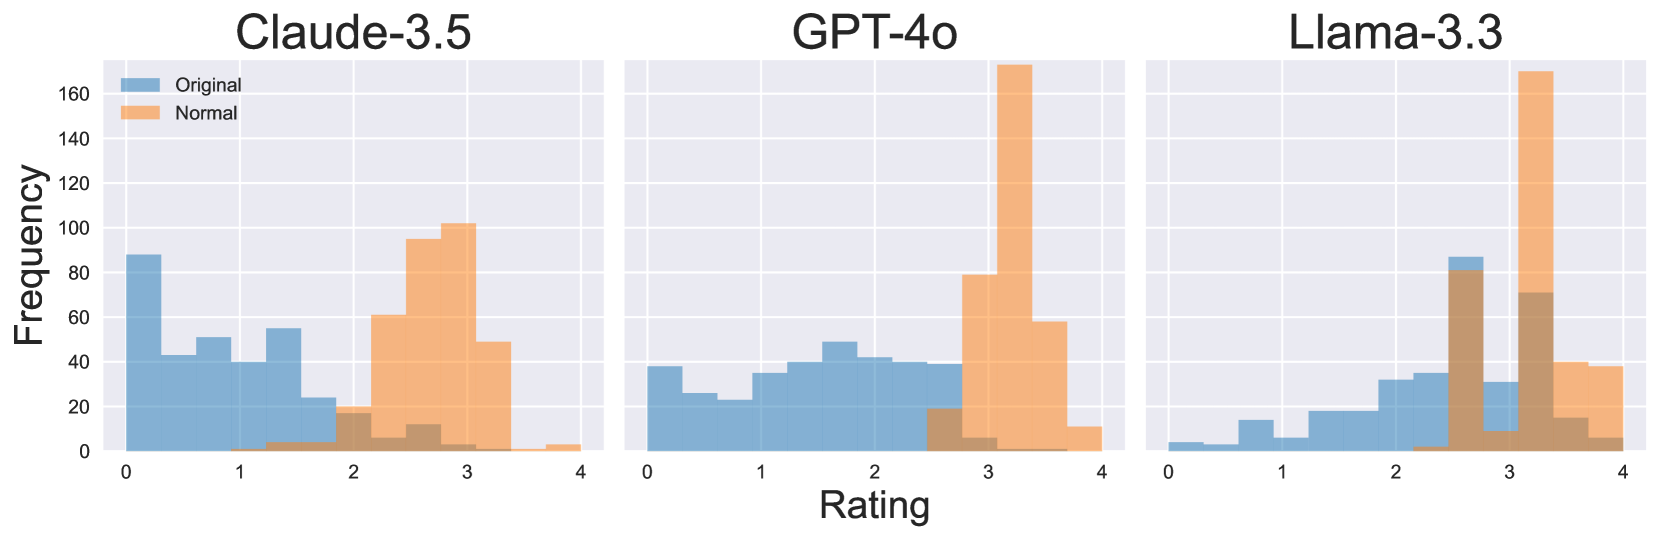
The image displays three horizontally arranged histograms, each comparing the frequency distribution of ratings for a different large language model (LLM). The models compared are "Claude-3.5", "GPT-4o", and "Llama-3.3". Each histogram plots two data series: "Original" (blue bars) and "Normal" (orange bars), showing how ratings are distributed across a scale from 0 to 4.
### Components/Axes
* **Titles:** Three main titles are positioned at the top center of each respective histogram panel: "Claude-3.5" (left), "GPT-4o" (center), and "Llama-3.3" (right).
* **X-Axis:** A shared x-axis at the bottom of the entire figure is labeled "Rating". It has major tick marks and numerical labels at 0, 1, 2, 3, and 4.
* **Y-Axis:** A shared y-axis on the far left is labeled "Frequency". It has major tick marks and numerical labels at 0, 20, 40, 60, 80, 100, 120, 140, and 160.
* **Legend:** A legend is located in the top-left corner of the "Claude-3.5" panel. It contains two entries:
* A blue square labeled "Original".
* An orange square labeled "Normal".
* **Data Series:** The histograms use overlapping, semi-transparent bars. The "Original" series is rendered in a medium blue, and the "Normal" series is rendered in a light orange. Where the bars overlap, a brownish color is visible.
### Detailed Analysis
**1. Claude-3.5 (Left Panel)**
* **Original (Blue):** The distribution is heavily skewed toward lower ratings. The highest frequency bar is at rating 0 (approx. frequency 90). There are notable peaks at ratings ~0.5 (freq ~45), ~1.5 (freq ~55), and a smaller one at ~2.5 (freq ~15). The frequency drops to near zero for ratings above 3.
* **Normal (Orange):** The distribution is shifted significantly toward higher ratings. It forms a rough bell curve centered around rating 3. The peak is at rating 3 (approx. frequency 100). Substantial frequencies are seen at rating 2.5 (freq ~95) and rating 3.5 (freq ~50). Very low frequencies are present below rating 2.
**2. GPT-4o (Center Panel)**
* **Original (Blue):** The distribution is relatively flat and spread across the lower-to-mid range. Frequencies hover between 20 and 50 for ratings from 0 to 2.5. The highest point is a broad plateau between ratings 1.5 and 2.5 (freq ~40-50). Frequency drops sharply after rating 2.5.
* **Normal (Orange):** The distribution is extremely concentrated at the high end. It features a very tall, narrow peak at rating 3 (approx. frequency 170, the highest in the entire figure). A significant secondary bar is at rating 3.5 (freq ~60). Frequencies are minimal below rating 2.5.
**3. Llama-3.3 (Right Panel)**
* **Original (Blue):** The distribution shows a gradual increase from low to mid ratings. It starts very low at rating 0, rises to a peak at rating 2.5 (approx. frequency 85), and then declines. There is a notable secondary peak at rating 3 (freq ~35).
* **Normal (Orange):** The distribution is strongly bimodal. One mode aligns with the "Original" peak at rating 2.5 (freq ~80). The dominant mode is a very high peak at rating 3 (approx. frequency 170, similar to GPT-4o's peak). A substantial bar also exists at rating 3.5 (freq ~40).
### Key Observations
1. **Consistent Shift:** For all three models, the "Normal" condition (orange) results in a dramatic shift of the rating distribution toward higher values compared to the "Original" condition (blue).
2. **Peak Convergence:** The "Normal" distributions for GPT-4o and Llama-3.3 both show an exceptionally high frequency peak at exactly rating 3, suggesting a strong clustering effect.
3. **Model-Specific Original Distributions:** The "Original" ratings vary significantly by model: Claude-3.5 is left-skewed (low ratings), GPT-4o is flat/uniform in the low-mid range, and Llama-3.3 is right-skewed (mid-high ratings).
4. **Overlap Patterns:** The area of overlap (brown) between the two series is most pronounced in the mid-rating range (2-3) for all models, indicating this is where the two conditions' distributions most commonly intersect.
### Interpretation
This data strongly suggests that applying the "Normal" condition (the specific nature of which is not defined in the image) systematically and significantly improves the ratings given to these AI models. The effect is not merely a uniform shift but a transformation of the distribution shape.
* **For Claude-3.5 and GPT-4o,** the "Normal" condition appears to correct a deficit, moving ratings from a low or mediocre baseline to a high, concentrated score. The extreme peak at 3 for GPT-4o under "Normal" conditions may indicate a ceiling effect or a specific evaluation criterion that this model consistently satisfies perfectly under that condition.
* **For Llama-3.3,** the "Original" ratings were already higher, but the "Normal" condition still creates a powerful clustering at the top of the scale, amplifying its performance.
* **The "Original" distributions** likely reflect baseline performance on a specific task or benchmark, revealing inherent differences in model capability or behavior prior to the applied condition. The "Normal" condition acts as a powerful normalizing or enhancing intervention, reducing variance and pushing scores toward the top of the scale, particularly to the rating of 3. The absence of ratings at 4 in any significant quantity suggests the scale may be capped or that achieving a perfect 4 is exceptionally rare under the evaluation criteria used.