## Histogram Chart: Model Rating Distributions
### Overview
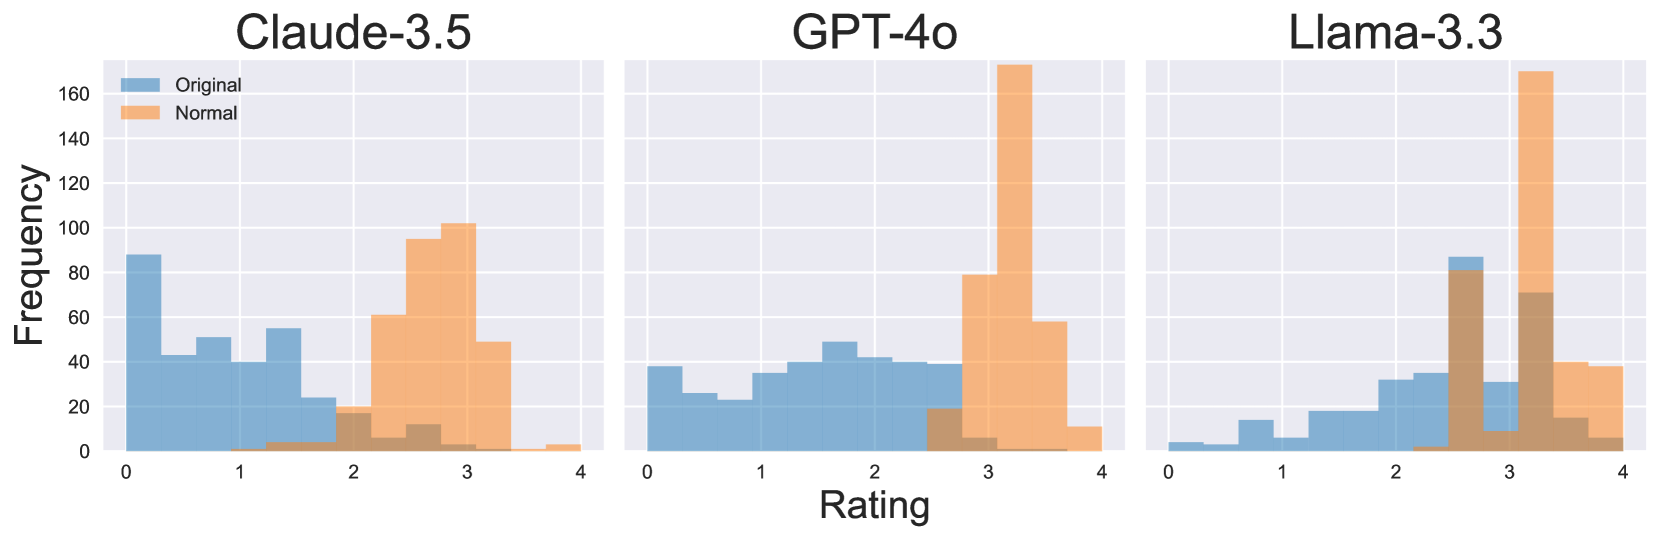
The image displays three side-by-side histograms comparing rating distributions for three AI models: Claude-3.5, GPT-4o, and Llama-3.3. Each histogram shows two distributions: "Original" (blue) and "Normal" (orange), with frequency counts on the y-axis and rating values (0-4) on the x-axis.
### Components/Axes
- **X-axis (Rating)**: Discrete values from 0 to 4 in integer increments
- **Y-axis (Frequency)**: Continuous scale from 0 to 160 in 20-unit increments
- **Legend**:
- Blue = Original
- Orange = Normal
- **Subplot Titles**:
- Left: Claude-3.5
- Center: GPT-4o
- Right: Llama-3.3
### Detailed Analysis
#### Claude-3.5
- **Original (Blue)**:
- Peak at 0 (80 frequency)
- Secondary peak at 1 (50 frequency)
- Gradual decline to 2 (30 frequency)
- Minimal presence at 3-4
- **Normal (Orange)**:
- Dominant peak at 3 (100 frequency)
- Smaller presence at 2 (60 frequency)
- Minimal presence at 0-1
#### GPT-4o
- **Original (Blue)**:
- Broad distribution across 0-2 (40-50 frequency)
- Slight dip at 3 (30 frequency)
- Minimal presence at 4
- **Normal (Orange)**:
- Extreme peak at 3 (170 frequency)
- Secondary presence at 2 (80 frequency)
- Minimal presence at 0-1
#### Llama-3.3
- **Original (Blue)**:
- Gradual increase from 0 (10 frequency) to 2 (30 frequency)
- Sharp peak at 3 (80 frequency)
- Minimal presence at 4
- **Normal (Orange)**:
- Dominant peak at 3 (170 frequency)
- Secondary presence at 2 (40 frequency)
- Minimal presence at 0-1
### Key Observations
1. **Normal Distribution Bias**: All models show significantly higher frequencies for "Normal" ratings at 3 compared to "Original" distributions
2. **GPT-4o Anomaly**: GPT-4o's "Normal" distribution has the highest frequency (170) at rating 3, exceeding its "Original" distribution by 130
3. **Claude-3.5 Original Pattern**: Claude-3.5's "Original" distribution shows a bimodal pattern with peaks at 0 and 1
4. **Llama-3.3 Original Pattern**: Llama-3.3's "Original" distribution shows a gradual increase toward higher ratings
### Interpretation
The data suggests systematic differences in how these models generate or interpret ratings:
- The "Normal" distributions across all models exhibit a strong central tendency toward rating 3, indicating potential algorithmic bias toward mid-range evaluations
- GPT-4o demonstrates the most extreme concentration of "Normal" ratings at 3, suggesting either stricter calibration or different training data characteristics
- Claude-3.5's bimodal "Original" distribution implies inherent variability in its baseline behavior
- The consistent pattern across models suggests this might reflect a common training methodology or evaluation framework rather than model-specific characteristics
The stark contrast between "Original" and "Normal" distributions raises questions about what constitutes "normal" behavior in these systems and whether the normalization process introduces artificial rating patterns.