## Line Graph: Effective Bandwidth vs. Offloading Ratio
### Overview
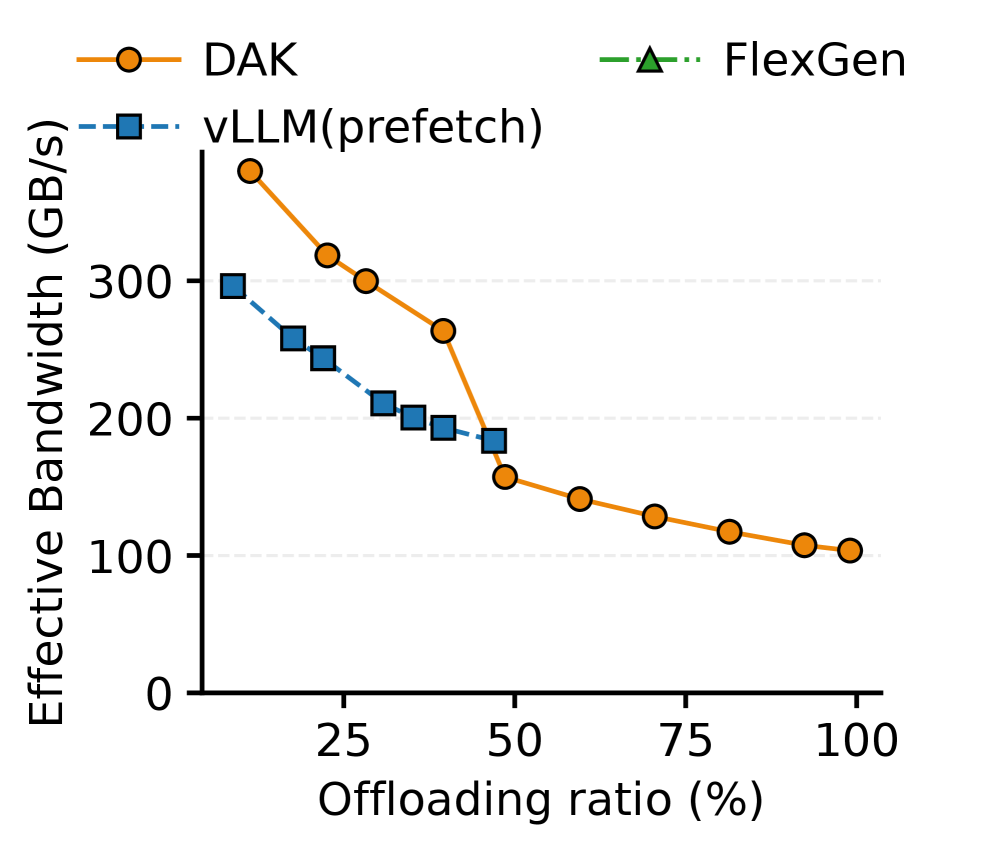
The image is a line graph comparing three data series: **DAK**, **vLLM (prefetch)**, and **FlexGen**, plotted against **offloading ratio (%)** on the x-axis and **effective bandwidth (GB/s)** on the y-axis. The graph shows how effective bandwidth decreases as offloading ratio increases, with distinct trends for each method.
---
### Components/Axes
- **X-axis**: Offloading ratio (%) (0 to 100% in increments of ~25%).
- **Y-axis**: Effective Bandwidth (GB/s) (0 to 350 in increments of ~100).
- **Legend**:
- **DAK**: Orange line with solid circles (top-right placement).
- **vLLM (prefetch)**: Dashed blue line with squares.
- **FlexGen**: Dotted green line with triangles (only appears at 100% offloading).
---
### Detailed Analysis
#### DAK (Orange Line)
- **Trend**: Steady decline from ~350 GB/s at 0% offloading to ~100 GB/s at 100% offloading.
- **Key Points**:
- 0%: ~350 GB/s.
- 25%: ~310 GB/s.
- 50%: ~180 GB/s.
- 75%: ~120 GB/s.
- 100%: ~100 GB/s.
#### vLLM (Prefetch) (Blue Dashed Line)
- **Trend**: Sharp decline, with a steeper drop after 50% offloading.
- **Key Points**:
- 0%: ~300 GB/s.
- 25%: ~240 GB/s.
- 50%: ~200 GB/s.
- 75%: ~50 GB/s (estimated from graph curvature).
- 100%: ~50 GB/s (data point overlaps FlexGen at 100%).
#### FlexGen (Green Dotted Line)
- **Trend**: Only visible at 100% offloading, with a single data point.
- **Key Point**:
- 100%: ~5 GB/s (data point labeled with green triangle).
---
### Key Observations
1. **DAK** maintains the highest effective bandwidth across all offloading ratios but shows gradual degradation.
2. **vLLM (prefetch)** experiences a **nonlinear drop**, with bandwidth plummeting to ~50 GB/s at 75% and 100% offloading.
3. **FlexGen** is only plotted at 100% offloading, where it achieves ~5 GB/s, significantly lower than other methods at the same ratio.
4. **vLLM** and **FlexGen** converge at 100% offloading (~50 GB/s for vLLM vs. ~5 GB/s for FlexGen), suggesting a potential anomaly or missing data for FlexGen at lower ratios.
---
### Interpretation
- **DAK** demonstrates **consistent scalability**, retaining ~70% of its initial bandwidth at 50% offloading, indicating robust performance under partial offloading.
- **vLLM (prefetch)** exhibits **diminishing returns**, with bandwidth collapsing sharply beyond 50% offloading, suggesting prefetching becomes inefficient at higher ratios.
- **FlexGen**’s isolated data point at 100% offloading raises questions:
- Is it designed for **full offloading only**?
- Why does its bandwidth (~5 GB/s) lag far behind vLLM’s ~50 GB/s at the same ratio? This could imply architectural limitations or a focus on latency over bandwidth.
- The **absence of FlexGen data at lower ratios** implies it may not be optimized for partial offloading, unlike DAK and vLLM.
---
### Notable Anomalies
- **vLLM vs. FlexGen at 100%**: The ~50 GB/s vs. ~5 GB/s disparity suggests either:
- FlexGen prioritizes other metrics (e.g., latency, energy efficiency).
- FlexGen’s implementation is incomplete or context-specific.
- **DAK’s smooth decline** contrasts with **vLLM’s abrupt drop**, highlighting differences in offloading strategies (e.g., prefetching vs. direct offloading).
---
### Conclusion
The graph illustrates trade-offs between offloading ratio and bandwidth efficiency. **DAK** balances scalability and performance, while **vLLM** struggles with high offloading ratios. **FlexGen**’s single data point hints at a specialized use case, but its performance at 100% offloading warrants further investigation.