## Line Chart: Goal Achievement Comparison
### Overview
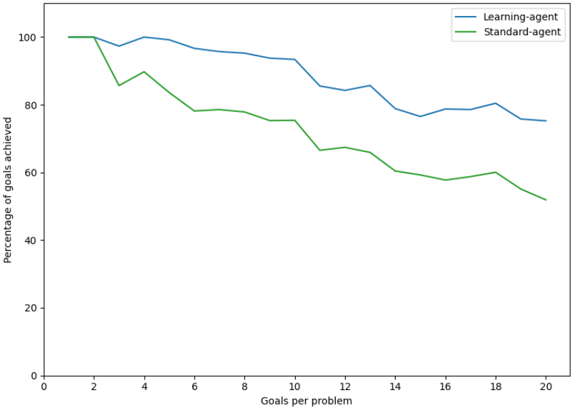
The image is a line chart comparing the percentage of goals achieved by a "Learning-agent" and a "Standard-agent" across a range of "Goals per problem" from 1 to 20. The chart displays the performance of each agent as the number of goals per problem increases.
### Components/Axes
* **X-axis:** "Goals per problem", ranging from 0 to 20 in increments of 2.
* **Y-axis:** "Percentage of goals achieved", ranging from 0 to 100 in increments of 20.
* **Legend (Top-Right):**
* Blue line: "Learning-agent"
* Green line: "Standard-agent"
### Detailed Analysis
* **Learning-agent (Blue Line):**
* Trend: Generally decreasing with some fluctuations.
* Data Points:
* At 1 goal per problem: Approximately 100%
* At 2 goals per problem: Approximately 100%
* At 4 goals per problem: Approximately 98%
* At 6 goals per problem: Approximately 96%
* At 8 goals per problem: Approximately 94%
* At 10 goals per problem: Approximately 94%
* At 12 goals per problem: Approximately 86%
* At 14 goals per problem: Approximately 85%
* At 16 goals per problem: Approximately 78%
* At 18 goals per problem: Approximately 80%
* At 20 goals per problem: Approximately 76%
* **Standard-agent (Green Line):**
* Trend: Decreasing.
* Data Points:
* At 1 goal per problem: Approximately 100%
* At 2 goals per problem: Approximately 100%
* At 4 goals per problem: Approximately 86%
* At 6 goals per problem: Approximately 80%
* At 8 goals per problem: Approximately 78%
* At 10 goals per problem: Approximately 78%
* At 12 goals per problem: Approximately 66%
* At 14 goals per problem: Approximately 64%
* At 16 goals per problem: Approximately 60%
* At 18 goals per problem: Approximately 58%
* At 20 goals per problem: Approximately 52%
### Key Observations
* Both agents start with 100% goal achievement at 1 and 2 goals per problem.
* The Learning-agent consistently outperforms the Standard-agent across all goal counts.
* The performance of both agents decreases as the number of goals per problem increases.
* The Standard-agent experiences a more significant drop in performance compared to the Learning-agent.
### Interpretation
The chart suggests that the "Learning-agent" is more effective at achieving goals as the complexity of the problem (number of goals per problem) increases. The "Standard-agent" shows a more pronounced decline in performance, indicating it may not adapt as well to more complex scenarios. The data implies that the learning mechanisms implemented in the "Learning-agent" provide a performance advantage over the "Standard-agent," especially when dealing with a higher number of goals per problem.