\n
## Line Chart: Goal Achievement Comparison
### Overview
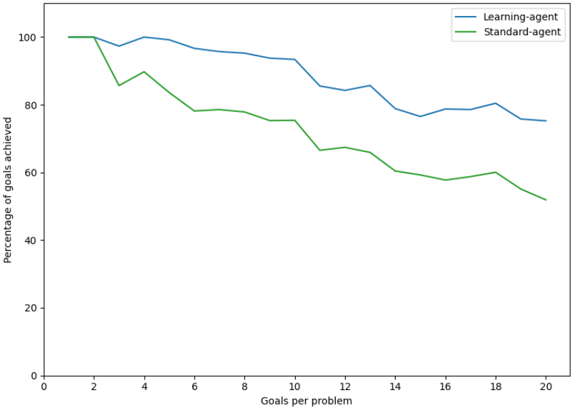
This image presents a line chart comparing the percentage of goals achieved by a "Learning-agent" and a "Standard-agent" as the number of goals per problem increases. The x-axis represents the number of goals per problem, ranging from 0 to 18. The y-axis represents the percentage of goals achieved, ranging from 0 to 100.
### Components/Axes
* **X-axis Title:** "Goals per problem"
* **Y-axis Title:** "Percentage of goals achieved"
* **X-axis Scale:** Linear, from 0 to 18, with markers at integer values.
* **Y-axis Scale:** Linear, from 0 to 100, with markers at 20-unit intervals.
* **Legend:** Located in the top-right corner.
* **Blue Line:** "Learning-agent"
* **Green Line:** "Standard-agent"
### Detailed Analysis
**Learning-agent (Blue Line):**
The Learning-agent line starts at approximately 102% at 0 goals per problem, then decreases with a slight fluctuation.
* 0 Goals: ~102%
* 2 Goals: ~96%
* 4 Goals: ~94%
* 6 Goals: ~92%
* 8 Goals: ~91%
* 10 Goals: ~88%
* 12 Goals: ~84%
* 14 Goals: ~79%
* 16 Goals: ~77%
* 18 Goals: ~79%
**Standard-agent (Green Line):**
The Standard-agent line begins at approximately 88% at 0 goals per problem, initially dips, then exhibits a more consistent downward trend.
* 0 Goals: ~88%
* 2 Goals: ~89%
* 4 Goals: ~82%
* 6 Goals: ~79%
* 8 Goals: ~77%
* 10 Goals: ~69%
* 12 Goals: ~66%
* 14 Goals: ~64%
* 16 Goals: ~61%
* 18 Goals: ~59%
### Key Observations
* The Learning-agent consistently outperforms the Standard-agent across all numbers of goals per problem.
* Both agents show a decrease in goal achievement percentage as the number of goals per problem increases.
* The Learning-agent's performance decline is less steep than that of the Standard-agent.
* The Learning-agent starts with a value slightly above 100%, which is likely an artifact of the data or visualization.
### Interpretation
The data suggests that the Learning-agent is more robust to increasing problem complexity (as measured by the number of goals per problem) than the Standard-agent. While both agents experience a decline in performance with more goals, the Learning-agent maintains a higher success rate. This could indicate that the Learning-agent is better at adapting to more challenging scenarios or prioritizing goals effectively. The initial value above 100% for the Learning-agent is unusual and might warrant further investigation to understand its origin. It could be a rounding error, a data anomaly, or a specific characteristic of the measurement process. The consistent downward trend for both agents suggests that there is a limit to their ability to handle increasing complexity, and that performance degrades as the number of goals increases.