## Line Chart: Performance Comparison of Two Agents
### Overview
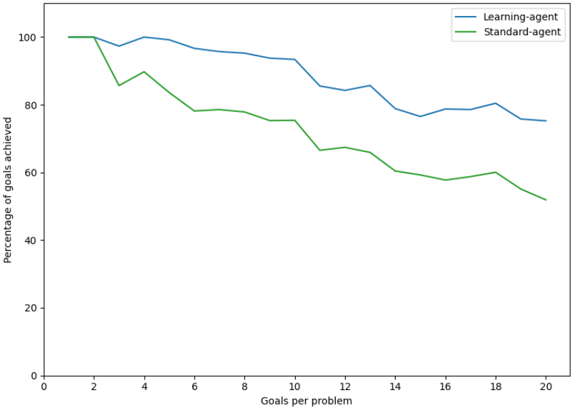
The image is a line chart comparing the performance of two agents, labeled "Learning-agent" and "Standard-agent," across varying levels of problem complexity. The chart plots the percentage of goals achieved against the number of goals per problem. Both agents start at 100% performance, but their success rates decline as the number of goals per problem increases, with the Learning-agent consistently outperforming the Standard-agent.
### Components/Axes
* **Chart Type:** Line chart with two data series.
* **X-Axis (Horizontal):**
* **Label:** "Goals per problem"
* **Scale:** Linear, ranging from 0 to 20.
* **Major Tick Marks:** At intervals of 2 (0, 2, 4, 6, 8, 10, 12, 14, 16, 18, 20).
* **Y-Axis (Vertical):**
* **Label:** "Percentage of goals achieved"
* **Scale:** Linear, ranging from 0 to 100.
* **Major Tick Marks:** At intervals of 20 (0, 20, 40, 60, 80, 100).
* **Legend:**
* **Position:** Top-right corner of the chart area.
* **Entries:**
1. **Blue Line:** "Learning-agent"
2. **Green Line:** "Standard-agent"
### Detailed Analysis
**Trend Verification:**
* **Learning-agent (Blue Line):** The line shows a gradual, generally downward trend with some minor fluctuations. It starts at 100% and ends at approximately 75%.
* **Standard-agent (Green Line):** The line shows a steeper, more pronounced downward trend. It starts at 100% and ends at approximately 50%.
**Data Point Extraction (Approximate Values):**
The following table reconstructs the approximate data points for each agent at the marked x-axis intervals. Values are estimated from the visual plot and carry inherent uncertainty.
| Goals per Problem (X) | Learning-agent (%) | Standard-agent (%) |
| :--- | :--- | :--- |
| 0 | 100 | 100 |
| 2 | 100 | ~85 |
| 4 | 100 | ~90 |
| 6 | ~97 | ~78 |
| 8 | ~95 | ~78 |
| 10 | ~94 | ~75 |
| 12 | ~85 | ~67 |
| 14 | ~86 | ~60 |
| 16 | ~79 | ~58 |
| 18 | ~81 | ~60 |
| 20 | ~75 | ~50 |
**Key Observations:**
1. **Initial Divergence:** Both agents begin at 100% success for 0-2 goals per problem. The first significant performance drop occurs for the Standard-agent between 2 and 3 goals per problem (from 100% to ~85%), while the Learning-agent maintains 100% until after 4 goals.
2. **Performance Gap:** A clear and consistent performance gap emerges after 4 goals per problem and widens as complexity increases. The Learning-agent's line remains above the Standard-agent's line for all values greater than 4.
3. **Rate of Decline:** The Standard-agent's performance declines at a faster rate. Its line has a steeper negative slope, particularly between 10-12 and 18-20 goals per problem.
4. **Fluctuations:** Both lines exhibit minor fluctuations (e.g., the Standard-agent's slight recovery at 4 and 18 goals), but the overall downward trajectory is unambiguous.
### Interpretation
The data demonstrates a clear relationship between problem complexity (number of goals) and agent performance. The key finding is that the **Learning-agent exhibits superior scalability and robustness** compared to the Standard-agent.
* **What the data suggests:** The Learning-agent's mechanism allows it to maintain a higher percentage of goal achievement as the task becomes more complex. The Standard-agent's performance degrades more rapidly, indicating it is less capable of handling multi-goal problems.
* **How elements relate:** The x-axis represents increasing task difficulty. The diverging lines show that the advantage of the "Learning" mechanism becomes more pronounced under greater challenge. The consistent gap between the lines is the visual representation of this performance advantage.
* **Notable Anomalies:** The sharp initial drop for the Standard-agent at low complexity (2-3 goals) is notable. It suggests a potential threshold where even a small increase in complexity significantly impacts the non-learning system, whereas the learning system adapts more gracefully.
* **Underlying Implication:** The chart provides empirical evidence that the learning component integrated into the "Learning-agent" confers a significant advantage in achieving goals within more complex, multi-objective scenarios. This has implications for designing autonomous systems intended for real-world tasks where problems are rarely singular.