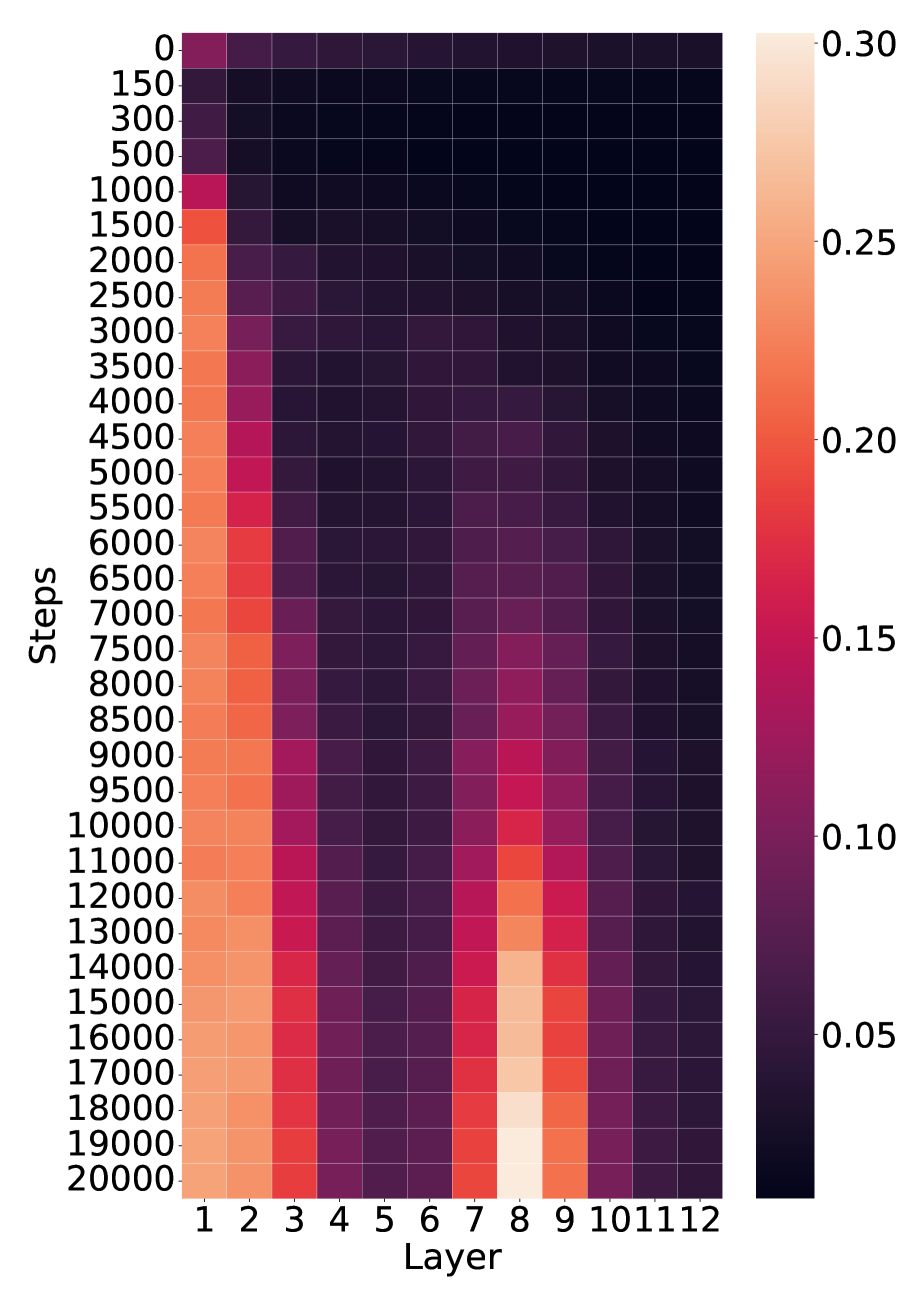
## Heatmap: Layer vs. Steps
### Overview
The image presents a heatmap visualizing a relationship between "Steps" and "Layer". The color intensity represents a numerical value, ranging from approximately 0.05 to 0.30. The heatmap appears to represent some kind of iterative process or simulation, where the value changes with both the layer and the step.
### Components/Axes
* **X-axis:** "Layer", ranging from 1 to 12. The axis is labeled with integer values.
* **Y-axis:** "Steps", ranging from 0 to 20000, with increments of 150, 300, 500, 1000, 1500, 2000, 2500, 3000, 3500, 4000, 4500, 5000, 5500, 6000, 6500, 7000, 7500, 8000, 8500, 9000, 9500, 10000, 12000, 13000, 14000, 15000, 16000, 17000, 18000, 19000, and 20000.
* **Color Scale (Legend):** Located on the right side of the heatmap. The scale ranges from approximately 0.05 (dark purple) to 0.30 (yellow). Intermediate values are: 0.10, 0.15, 0.20, 0.25.
### Detailed Analysis
The heatmap shows a complex pattern of values. Here's a breakdown of the observed trends:
* **Layer 1-7:** For the first 7 layers, the heatmap shows a generally decreasing trend in value as the number of steps increases. The values start around 0.25-0.30 at Step 0 and decrease to approximately 0.05-0.10 by Step 20000.
* **Layer 8:** Layer 8 exhibits a different pattern. It starts with a lower value (around 0.10-0.15) at Step 0 and increases to a peak around Step 5000-6000 (approximately 0.25-0.30) before decreasing again.
* **Layer 9-12:** Layers 9 through 12 show a similar pattern to Layer 8, with an initial low value, a peak around Step 5000-6000, and a subsequent decrease. The peak values are generally lower than those in Layer 8, ranging from approximately 0.15 to 0.20.
Here's a reconstruction of some approximate data points (values are estimates based on color matching):
| Layer | Step 0 | Step 1500 | Step 5000 | Step 10000 | Step 20000 |
|---|---|---|---|---|---|
| 1 | 0.28 | 0.22 | 0.12 | 0.08 | 0.06 |
| 2 | 0.27 | 0.21 | 0.11 | 0.07 | 0.05 |
| 3 | 0.26 | 0.20 | 0.10 | 0.06 | 0.05 |
| 4 | 0.25 | 0.19 | 0.09 | 0.05 | 0.04 |
| 5 | 0.24 | 0.18 | 0.08 | 0.04 | 0.04 |
| 6 | 0.23 | 0.17 | 0.07 | 0.03 | 0.03 |
| 7 | 0.22 | 0.16 | 0.06 | 0.03 | 0.03 |
| 8 | 0.12 | 0.18 | 0.27 | 0.15 | 0.08 |
| 9 | 0.10 | 0.15 | 0.22 | 0.12 | 0.06 |
| 10 | 0.09 | 0.14 | 0.20 | 0.11 | 0.05 |
| 11 | 0.08 | 0.13 | 0.18 | 0.10 | 0.04 |
| 12 | 0.07 | 0.12 | 0.16 | 0.09 | 0.03 |
### Key Observations
* The initial layers (1-7) exhibit a consistent decreasing trend.
* Layers 8-12 show a non-monotonic behavior, with an initial increase followed by a decrease.
* The peak values in Layers 8-12 are lower than the initial values in Layers 1-7.
* The values generally decrease as the number of steps increases, except for the peak observed in Layers 8-12.
### Interpretation
The heatmap likely represents the evolution of some metric over iterative steps for different layers of a system. The decreasing trend in the first seven layers could indicate a convergence or stabilization process. The subsequent increase and decrease in layers 8-12 suggest a more complex dynamic, potentially involving oscillations or a temporary increase in the metric before settling down.
The difference in behavior between the first seven layers and the later layers could be due to a change in the system's parameters or a transition to a different operating regime. The peak in layers 8-12 might represent a temporary overshoot or a local maximum in the metric's evolution.
Without further context, it's difficult to determine the exact meaning of the "Steps" and "Layer" variables and the metric being visualized. However, the heatmap provides valuable insights into the system's behavior and suggests potential areas for further investigation. The data suggests that the system is not uniformly stable across all layers and that the dynamics can change significantly depending on the layer number.