## Diagram: Spatial Navigation Task Interface
### Overview
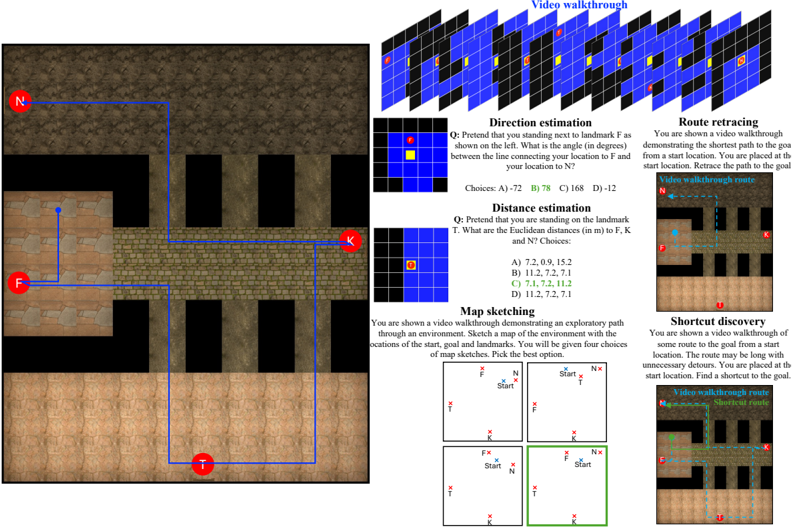
The image depicts a technical interface for a spatial navigation experiment. It includes a grid-based environment map, task instructions, and example responses. The layout is divided into sections for different cognitive tasks (e.g., direction estimation, route retracing) with embedded diagrams, multiple-choice questions, and video walkthrough references.
### Components/Axes
1. **Main Environment Map (Left Side)**
- **Grid Layout**: A 3x3 grid with labeled landmarks:
- **N** (North, top-left corner)
- **F** (Front, bottom-left corner)
- **K** (Key, top-right corner)
- **T** (Target, bottom-right corner)
- **Path Highlighting**: Blue lines connect landmarks, indicating navigational routes.
- **Color Coding**:
- Blue lines: Pathways
- Red circles: Landmark positions
2. **Task Sections (Right Side)**
- **Direction Estimation**:
- Question: *"Pretend you are standing next to landmark F. What is the angle (in degrees) between the line connecting your location to F and your location to N?"*
- Choices: A) 72, B) 78, C) 168, D) 12
- Video Walkthrough: Grid showing blue/yellow squares with red/yellow dots.
- **Distance Estimation**:
- Question: *"You are standing on landmark T. What are the Euclidean distances (in meters) to F, K, and N?"*
- Choices: A) 7.2, 0.9, 1.5; B) 1.2, 7.2, 7.1; C) 7.1, 7.2, 11.2; D) 1.2, 7.2, 7.1
- **Map Sketching**:
- Instructions: *"Sketch the environment with start, goal, and landmarks. Choose the best option."*
- Example Responses: Two grid-based maps with labeled landmarks (F, T, K, N) and start/goal positions.
- **Route Retracing**:
- Question: *"Retrace the shortest path from start to goal in the video walkthrough."*
- Diagram: Grid with dashed blue lines showing the path.
- **Shortcut Discovery**:
- Question: *"Find a shortcut from start to goal in the video walkthrough."*
- Diagram: Grid with dotted blue lines indicating the shortcut.
### Detailed Analysis
- **Landmark Positions**:
- N (North) is at the top-left, F (Front) at the bottom-left, K (Key) at the top-right, and T (Target) at the bottom-right.
- Blue lines connect N→F→T→K, forming a loop.
- **Task Formats**:
- All tasks use grid-based diagrams with labeled landmarks.
- Multiple-choice questions test spatial reasoning (angles, distances, pathfinding).
- Video walkthroughs are referenced as visual aids for each task.
- **Color Legend**:
- Blue: Pathways/navigation routes
- Red: Landmark markers
- Yellow: Highlighted landmarks in video walkthroughs
### Key Observations
1. **Spatial Reasoning Focus**: Tasks emphasize angle estimation, distance calculation, and path optimization.
2. **Ambiguity in Choices**: Some distance options (e.g., A: 7.2, 0.9, 1.5) may conflict with grid proportions, suggesting potential errors or intentional distractors.
3. **Video Walkthrough Integration**: Tasks rely on visual demonstrations, implying a multimodal experimental design.
### Interpretation
This interface likely belongs to a study on **cognitive mapping** or **navigation skill assessment**. The tasks simulate real-world wayfinding challenges, requiring participants to:
- Infer spatial relationships from partial information (e.g., video walkthroughs).
- Compare mental maps to actual layouts (map sketching).
- Optimize routes (shortcut discovery).
The inclusion of multiple-choice formats suggests automated scoring, while the grid-based diagrams standardize responses for analysis. The experiment may explore how individuals process spatial information in dynamic environments, with applications in robotics, psychology, or urban planning.
**Note**: No numerical data trends are present, as the image focuses on task structure rather than statistical results.