\n
## Radar Chart: Comparative Assessment of Security Taxonomies
### Overview
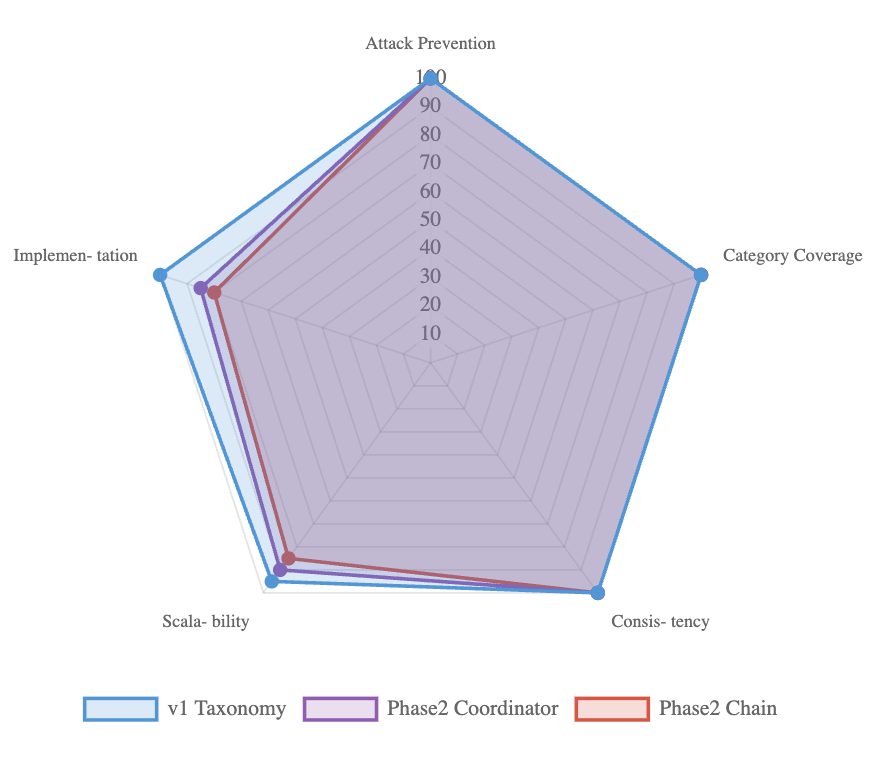
This image presents a radar chart comparing three security taxonomies: "v1 Taxonomy", "Phase2 Coordinator", and "Phase2 Chain" across five categories: "Attack Prevention", "Category Coverage", "Consistency", "Scalability", and "Implementation". The chart uses a radial scale from 0 to 100 to represent performance or coverage within each category.
### Components/Axes
* **Axes:** Five radial axes representing the categories:
* Attack Prevention
* Category Coverage
* Consistency
* Scalability
* Implementation
* **Scale:** Radial scale ranging from 0 to 100, with markings at intervals of 10.
* **Legend:** Located at the bottom-center of the chart.
* v1 Taxonomy (Blue line)
* Phase2 Coordinator (Purple line)
* Phase2 Chain (Red line)
### Detailed Analysis
The chart displays three polygonal lines, each representing one of the taxonomies. The lines connect points on each of the five axes, indicating the score for that taxonomy in each category.
* **v1 Taxonomy (Blue):**
* Attack Prevention: Approximately 95.
* Category Coverage: Approximately 65.
* Consistency: Approximately 25.
* Scalability: Approximately 20.
* Implementation: Approximately 40.
* Trend: Starts high at Attack Prevention, declines sharply through Consistency and Scalability, then rises slightly at Implementation.
* **Phase2 Coordinator (Purple):**
* Attack Prevention: Approximately 60.
* Category Coverage: Approximately 60.
* Consistency: Approximately 60.
* Scalability: Approximately 60.
* Implementation: Approximately 60.
* Trend: Relatively flat line, indicating consistent performance across all categories.
* **Phase2 Chain (Red):**
* Attack Prevention: Approximately 80.
* Category Coverage: Approximately 50.
* Consistency: Approximately 40.
* Scalability: Approximately 30.
* Implementation: Approximately 40.
* Trend: Starts high at Attack Prevention, declines steadily through the remaining categories.
### Key Observations
* The "v1 Taxonomy" excels in "Attack Prevention" but significantly underperforms in "Consistency" and "Scalability".
* "Phase2 Coordinator" demonstrates the most balanced performance across all categories, with a consistent score around 60.
* "Phase2 Chain" shows a similar trend to "v1 Taxonomy" – strong in "Attack Prevention" but declining in other areas.
* There is a significant performance gap between "v1 Taxonomy" and the other two taxonomies in "Consistency" and "Scalability".
### Interpretation
The radar chart suggests that the "v1 Taxonomy" is highly focused on preventing attacks but lacks robustness in terms of consistency and scalability. This could indicate that it is a specialized taxonomy that is effective in specific scenarios but may not be suitable for broader or more complex environments.
The "Phase2 Coordinator" taxonomy appears to be a more general-purpose solution, offering a balanced level of performance across all categories. This suggests it may be a more versatile option for organizations with diverse security needs.
The "Phase2 Chain" taxonomy falls somewhere in between, offering good attack prevention but with similar weaknesses to "v1 Taxonomy" in consistency and scalability.
The chart highlights the trade-offs between different security taxonomy designs. A taxonomy optimized for attack prevention may sacrifice consistency or scalability, while a more balanced taxonomy may offer broader coverage but at the expense of specialized performance. The choice of taxonomy will depend on the specific requirements and priorities of the organization.