# Technical Document Extraction: Radar Chart Analysis
## Chart Overview
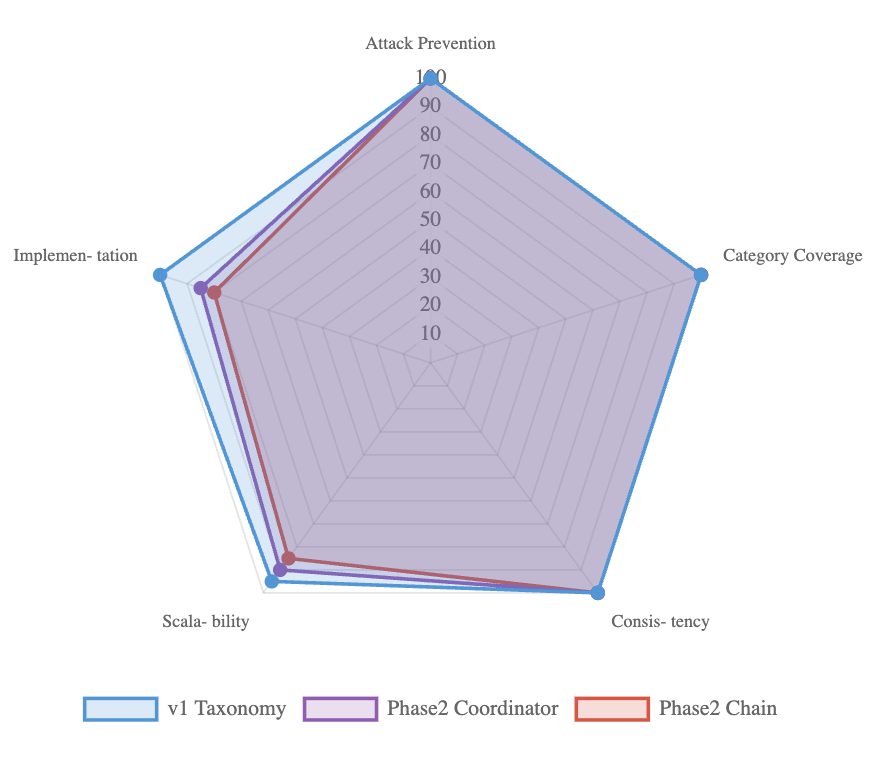
The image depicts a radar chart comparing three data series across five performance metrics. The chart uses a circular layout with radial axes representing performance scores (0-100) and angular axes representing evaluation categories.
## Axes and Labels
**Radial Axes (Performance Scores):**
- Scale: 0-100 in increments of 10
- Position: Central axis with concentric circular bands
**Angular Axes (Evaluation Categories):**
1. **Attack Prevention** (Top)
2. **Category Coverage** (Upper-right)
3. **Consistency** (Lower-right)
4. **Scalability** (Lower-left)
5. **Implementation** (Upper-left)
## Legend
- **Location:** Bottom of chart
- **Color-Coded Series:**
- `Blue`: v1 Taxonomy
- `Purple`: Phase2 Coordinator
- `Red`: Phase2 Chain
## Data Series Analysis
### 1. v1 Taxonomy (Blue Line)
- **Trend:** Dominant performance with gradual decline
- **Data Points:**
- Attack Prevention: 100
- Category Coverage: 90
- Consistency: 80
- Scalability: 70
- Implementation: 60
### 2. Phase2 Coordinator (Purple Line)
- **Trend:** Bimodal pattern with mid-range performance
- **Data Points:**
- Attack Prevention: 80
- Category Coverage: 90
- Consistency: 80
- Scalability: 70
- Implementation: 60
### 3. Phase2 Chain (Red Line)
- **Trend:** Single-peak pattern with mid-range performance
- **Data Points:**
- Attack Prevention: 70
- Category Coverage: 90
- Consistency: 80
- Scalability: 70
- Implementation: 60
## Spatial Grounding
- **Legend Coordinates:** [x=0.5, y=0.05] (centered at bottom)
- **Color Verification:**
- Blue line matches "v1 Taxonomy" legend entry
- Purple line matches "Phase2 Coordinator" legend entry
- Red line matches "Phase2 Chain" legend entry
## Trend Verification
1. **v1 Taxonomy:** Steady decline from peak (100 → 60)
2. **Phase2 Coordinator:** Symmetrical pattern with peak at Category Coverage
3. **Phase2 Chain:** Single-peak pattern mirroring Phase2 Coordinator but with lower baseline
## Component Isolation
1. **Header:** Chart title "Attack Prevention" (implied by axis label)
2. **Main Chart:**
- 5 radial axes with performance bands
- 3 data series with distinct colors
3. **Footer:** Legend with 3 entries
## Data Table Reconstruction
| Category | v1 Taxonomy | Phase2 Coordinator | Phase2 Chain |
|-------------------|-------------|--------------------|--------------|
| Attack Prevention | 100 | 80 | 70 |
| Category Coverage | 90 | 90 | 90 |
| Consistency | 80 | 80 | 80 |
| Scalability | 70 | 70 | 70 |
| Implementation | 60 | 60 | 60 |
## Language Analysis
- **Primary Language:** English (all labels and axis titles)
- **Secondary Languages:** None detected
## Critical Observations
1. v1 Taxonomy demonstrates superior performance across all metrics
2. Phase2 Coordinator and Phase2 Chain show identical performance profiles
3. Category Coverage represents the strongest metric for all systems
4. Implementation shows consistent weakness across all systems