## Density Plot: General Text vs. Medical Text
### Overview
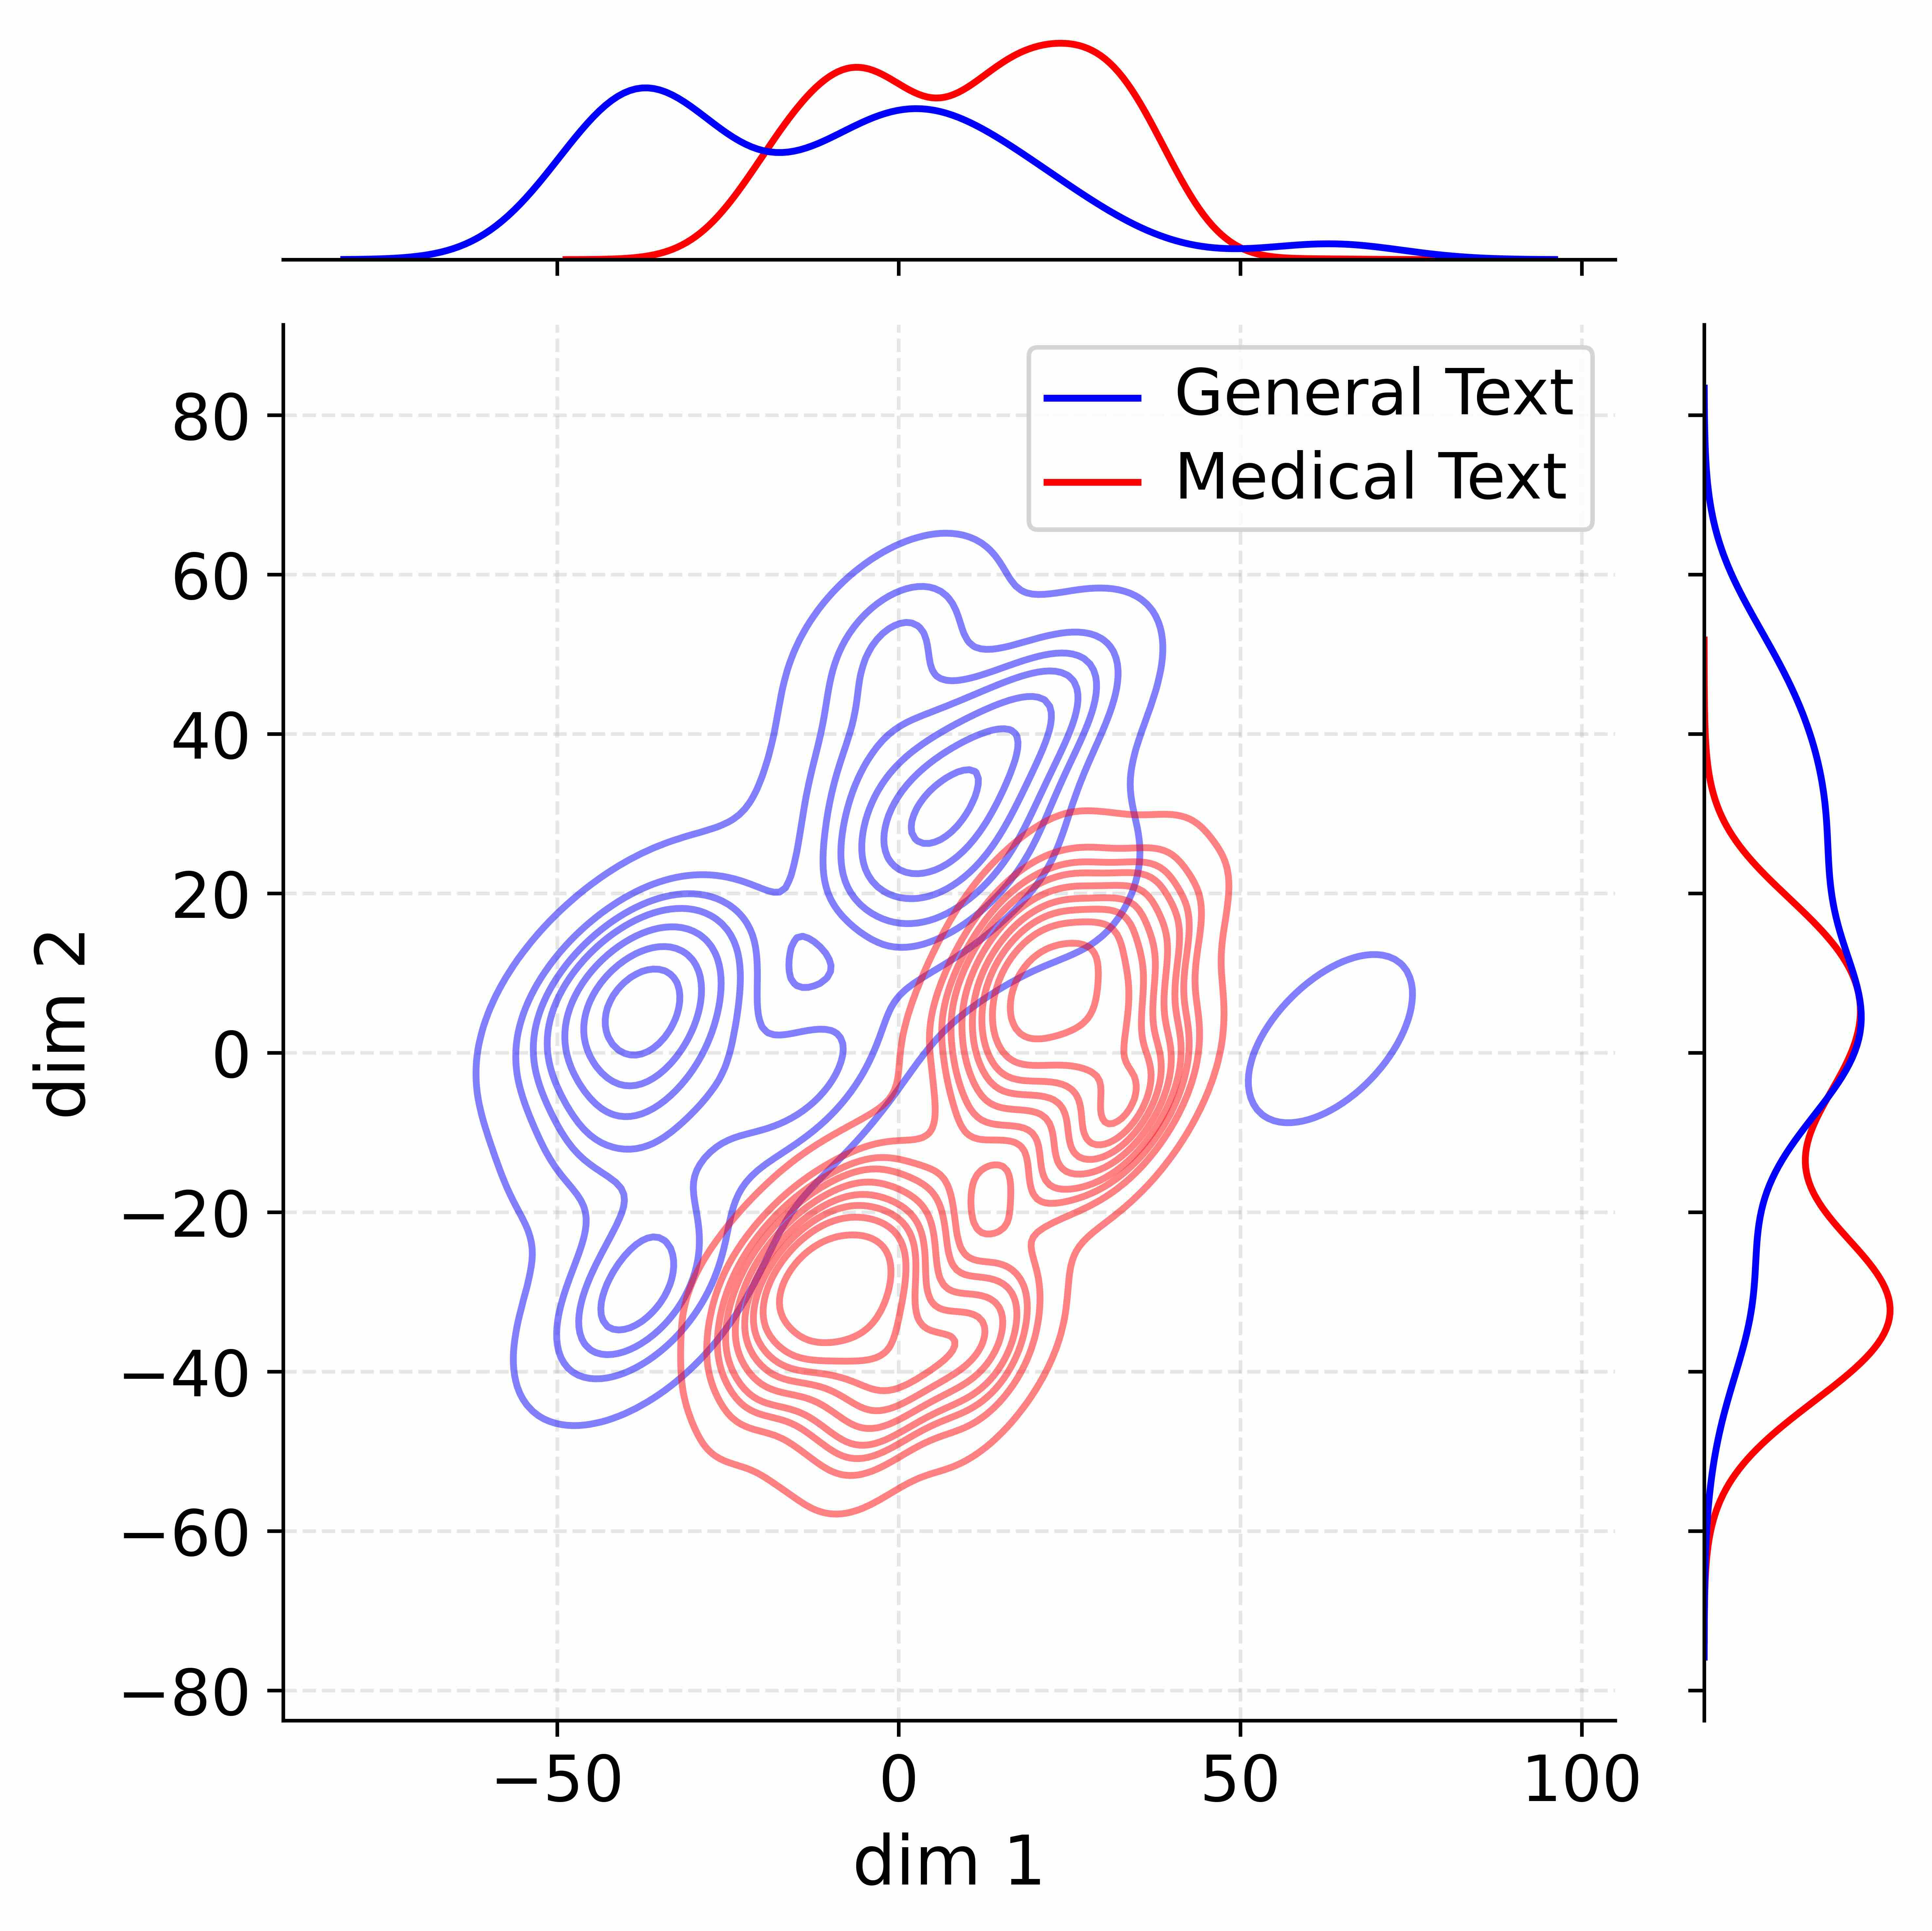
The image is a density plot comparing "General Text" and "Medical Text" across two dimensions, labeled "dim 1" and "dim 2". The plot includes contour lines representing the density of each type of text, along with marginal density plots along the top and right axes.
### Components/Axes
* **Main Plot:** A 2D density plot with "dim 1" on the x-axis and "dim 2" on the y-axis.
* **X-axis (dim 1):** Ranges from approximately -50 to 100, with tick marks at -50, 0, 50, and 100.
* **Y-axis (dim 2):** Ranges from approximately -80 to 80, with tick marks at -80, -60, -40, -20, 0, 20, 40, 60, and 80.
* **Legend:** Located at the top-right of the main plot.
* **Blue Line:** Represents "General Text".
* **Red Line:** Represents "Medical Text".
* **Top Marginal Plot:** Shows the density distribution of "dim 1" for both "General Text" (blue) and "Medical Text" (red).
* **Right Marginal Plot:** Shows the density distribution of "dim 2" for both "General Text" (blue) and "Medical Text" (red).
* **Gridlines:** Light gray dashed lines provide visual reference points within the main plot.
### Detailed Analysis
* **General Text (Blue):**
* **Main Plot:** The density contours are concentrated in the upper-left quadrant, indicating higher density values for "General Text" in this region. The center of the highest density is around dim1 = -40 and dim2 = 10.
* **Top Marginal Plot:** The blue line shows a peak around dim 1 = -40, indicating a higher concentration of "General Text" along this dimension.
* **Right Marginal Plot:** The blue line shows a peak around dim 2 = 10, indicating a higher concentration of "General Text" along this dimension.
* **Medical Text (Red):**
* **Main Plot:** The density contours are concentrated in the lower-right quadrant, indicating higher density values for "Medical Text" in this region. The center of the highest density is around dim1 = 20 and dim2 = -20.
* **Top Marginal Plot:** The red line shows a peak around dim 1 = 20, indicating a higher concentration of "Medical Text" along this dimension.
* **Right Marginal Plot:** The red line shows a peak around dim 2 = -20, indicating a higher concentration of "Medical Text" along this dimension.
### Key Observations
* The density plots for "General Text" and "Medical Text" are clearly separated, suggesting distinct characteristics in the two-dimensional space.
* "General Text" is more concentrated in the region where dim 1 is negative and dim 2 is positive.
* "Medical Text" is more concentrated in the region where dim 1 is positive and dim 2 is negative.
* There is some overlap between the two density plots, indicating some similarity between "General Text" and "Medical Text" in certain regions of the two-dimensional space.
### Interpretation
The density plot visualizes the distribution of "General Text" and "Medical Text" across two dimensions, "dim 1" and "dim 2". The separation of the density contours suggests that these two types of text have distinct characteristics in this two-dimensional space. The marginal density plots provide further insight into the distribution of each type of text along each dimension. The plot could be used to understand the differences in the feature space of general and medical texts, potentially for classification or clustering purposes. The dimensions "dim 1" and "dim 2" are not defined, but they likely represent some underlying features extracted from the text data.