## Contour Plot with Line Graphs: Distribution of Text Types in 2D Space
### Overview
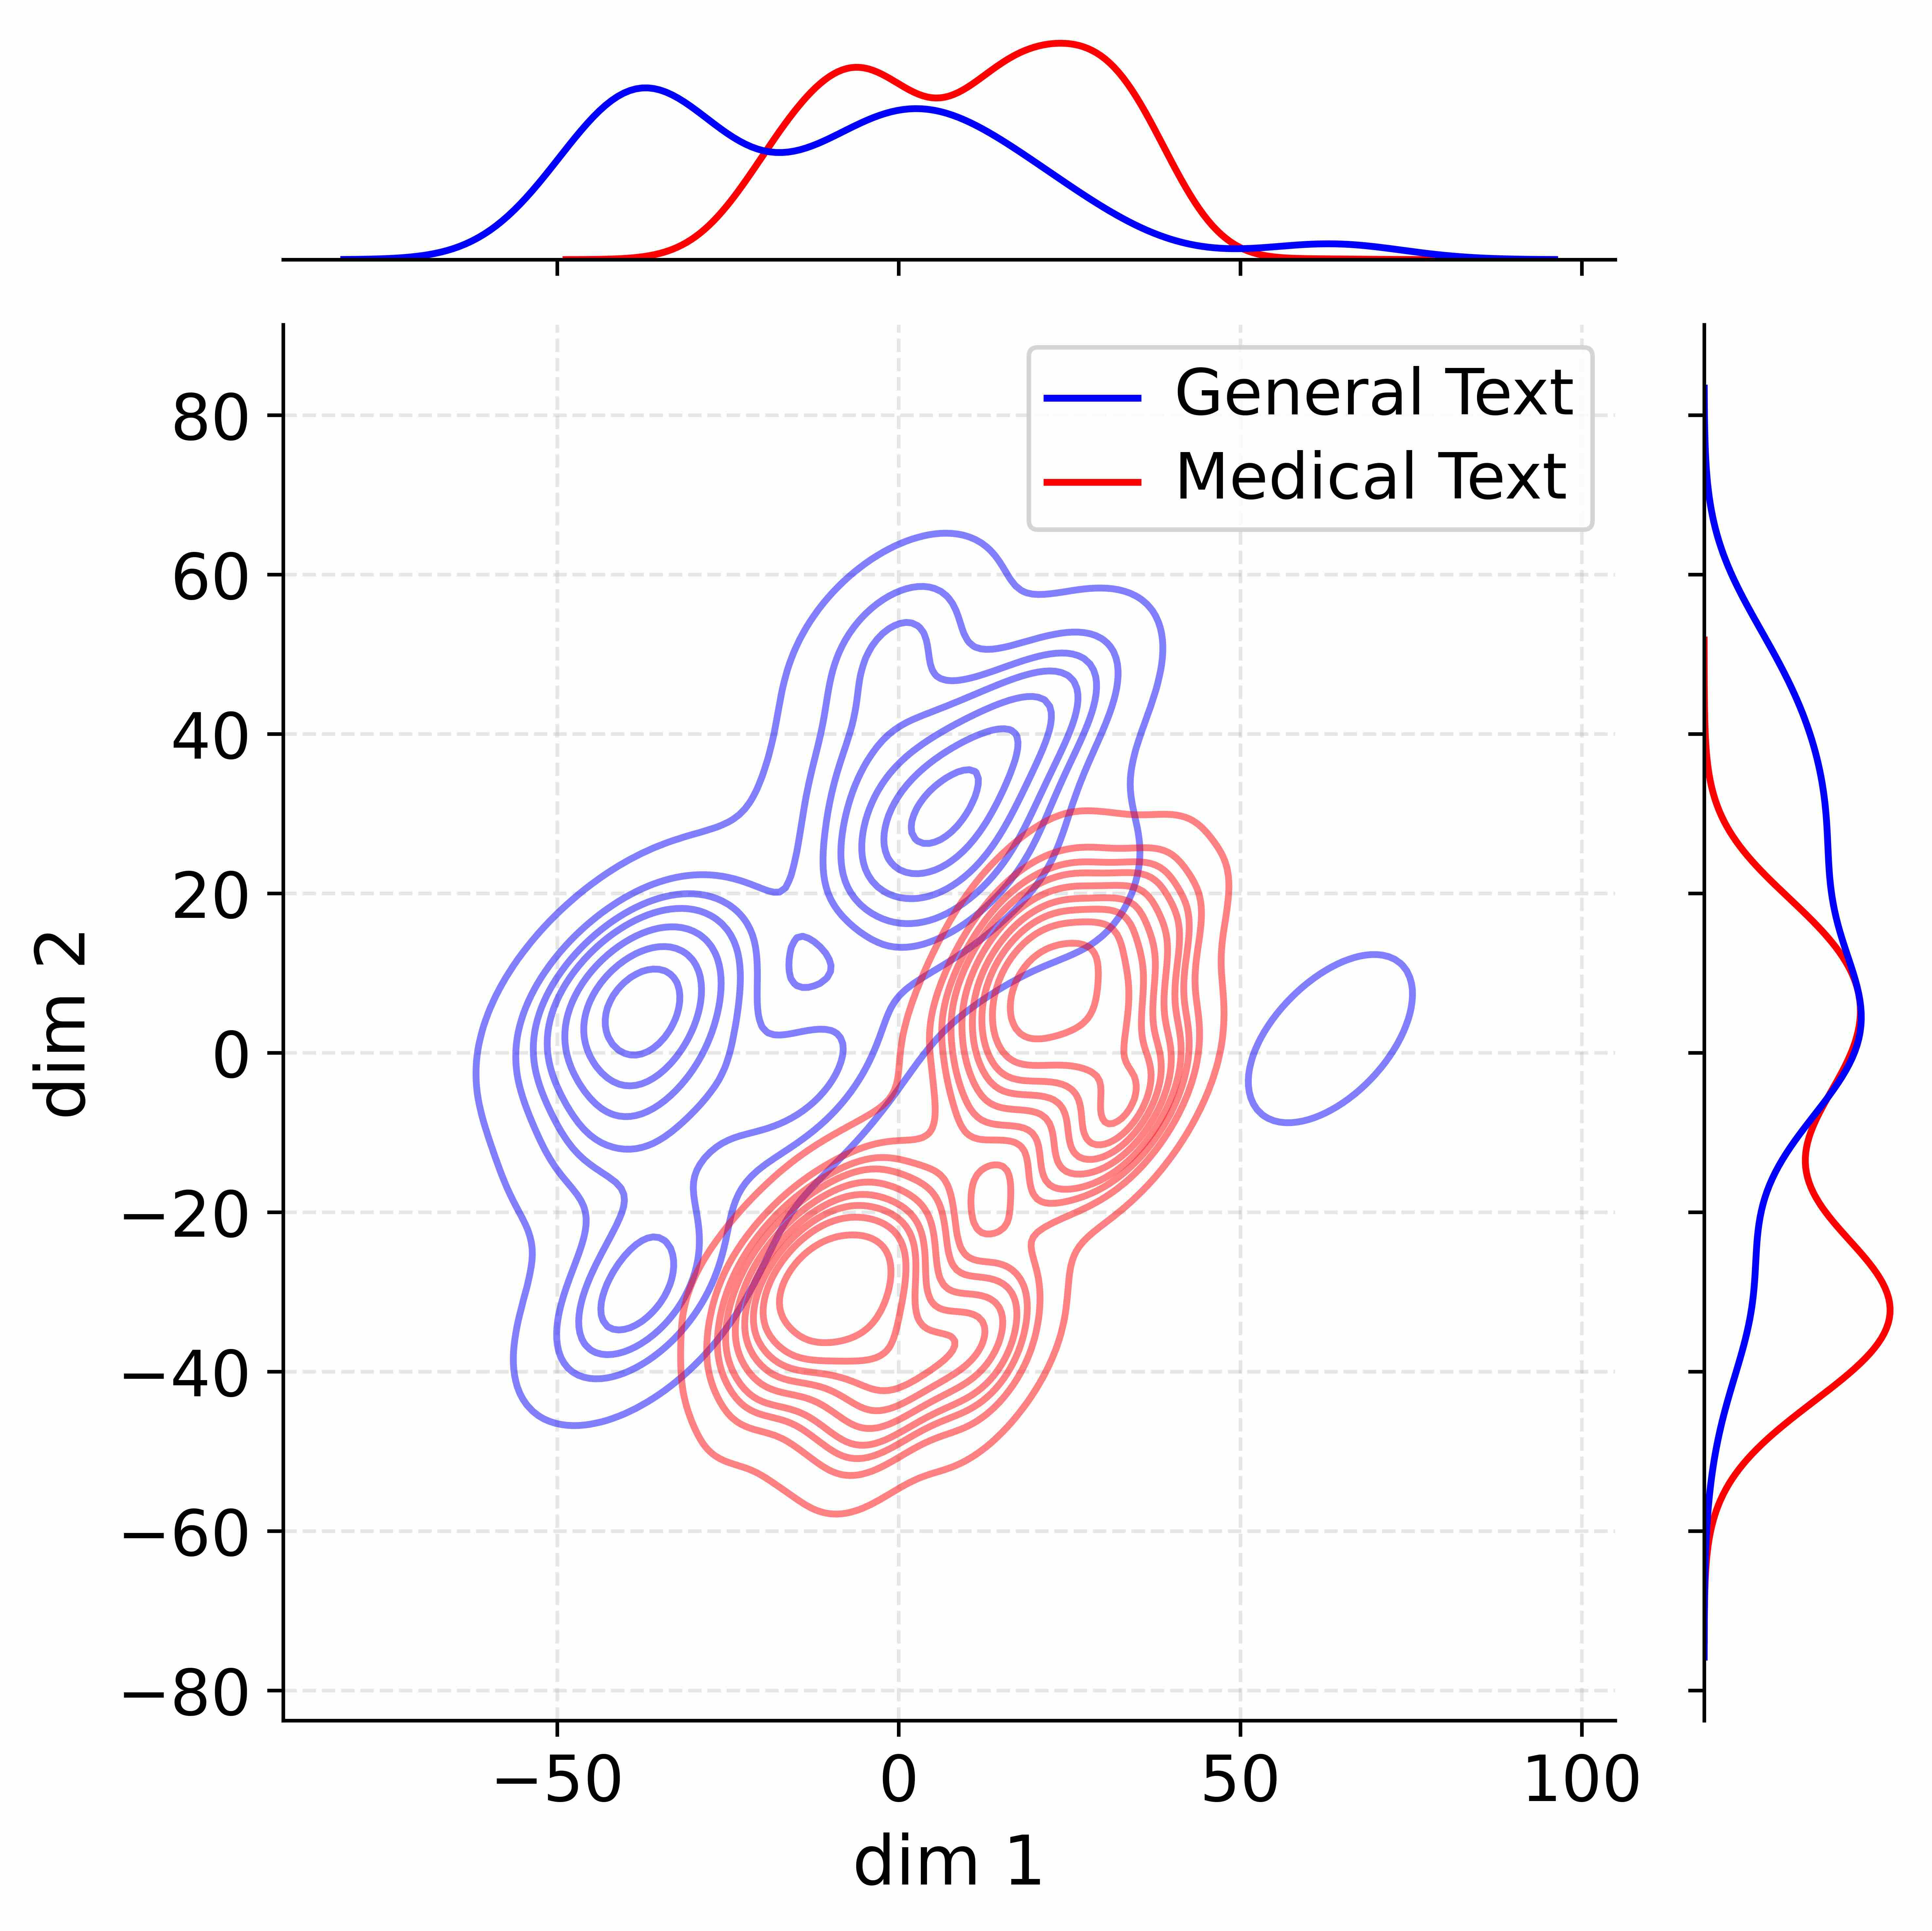
The image presents a 2D visualization comparing the distribution of two text types ("General Text" and "Medical Text") across two dimensions (dim 1 and dim 2). It combines a contour plot with marginal line graphs to show density distributions and univariate projections.
### Components/Axes
1. **Main Contour Plot**:
- **X-axis (dim 1)**: Ranges from -100 to 100.
- **Y-axis (dim 2)**: Ranges from -80 to 80.
- **Legend**: Located in the top-right corner of the contour plot.
- **Blue**: General Text
- **Red**: Medical Text
2. **Top Line Graphs**:
- **X-axis**: Labeled "dim 1" (matches contour plot).
- **Y-axis**: Labeled "dim 2" (matches contour plot).
- **Lines**:
- **Blue (General Text)**: Peaks at approximately -25 and 25 on dim 1.
- **Red (Medical Text)**: Peaks at approximately 0 and 50 on dim 1.
3. **Right Y-Axis Line Graphs**:
- **X-axis**: Labeled "dim 2" (matches contour plot).
- **Y-axis**: Unlabeled, but visually aligned with the contour plot's dim 2 axis.
- **Lines**:
- **Blue (General Text)**: Peaks near -60 and 60 on dim 2.
- **Red (Medical Text)**: Peaks near -20 and 40 on dim 2.
### Detailed Analysis
1. **Contour Plot**:
- **Blue (General Text)**: Concentrated in the left half of the plot (dim 1 < 0), with dense clusters around (-30, 0) and (-10, 20).
- **Red (Medical Text)**: Concentrated in the right half (dim 1 > 0), with dense clusters around (10, -10) and (30, 10).
- **Overlap**: Moderate overlap in the central region (dim 1: -10 to 10, dim 2: -20 to 20).
2. **Top Line Graphs**:
- **General Text (Blue)**: Bimodal distribution with peaks at dim 1 ≈ -25 and 25.
- **Medical Text (Red)**: Bimodal distribution with peaks at dim 1 ≈ 0 and 50.
3. **Right Y-Axis Line Graphs**:
- **General Text (Blue)**: Bimodal distribution with peaks at dim 2 ≈ -60 and 60.
- **Medical Text (Red)**: Bimodal distribution with peaks at dim 2 ≈ -20 and 40.
### Key Observations
1. **Dimensional Separation**:
- General Text clusters in the left half of dim 1 and lower dim 2 values.
- Medical Text clusters in the right half of dim 1 and higher dim 2 values.
2. **Overlap**:
- Central region (dim 1: -10 to 10, dim 2: -20 to 20) shows mixed densities, suggesting shared features or ambiguous classifications.
3. **Univariate Projections**:
- Both text types exhibit bimodal distributions in dim 1 and dim 2, indicating distinct subgroups within each category.
### Interpretation
The visualization demonstrates that General and Medical Texts occupy distinct regions in the 2D space, with clear separation along dim 1. However, the central overlap suggests potential ambiguity in distinguishing the two categories in this region. The bimodal distributions in both dimensions imply that each text type may contain subpopulations with unique characteristics. The marginal line graphs reinforce the bimodality observed in the contour plot, providing additional context for the multivariate distribution. This could reflect differences in linguistic patterns, topic focus, or stylistic features between general and medical texts.